Recipe Costing in Seconds: How a Cafe Uncovered 30% in Hidden Food Costs

Every restaurant operator knows that food cost is the single biggest variable expense in the business. Industry benchmarks say a healthy restaurant keeps food cost between 28 and 35 percent of menu price. But here is the problem with benchmarks: they measure what you spent on ingredients, not what you should have spent. The gap between theoretical food cost — what your recipes say you should use — and actual food cost — what your inventory says you did use — is where restaurants lose money.
Bella's Cafe, a breakfast-and-lunch spot in Portland, Oregon, had been operating for four years with what the owner considered acceptable food costs. The monthly profit and loss statement showed food cost running at 33 percent of revenue. Within the industry benchmark. Nothing to worry about. But when the owner, Elena Vargas, started using Mica to build a proper recipe costing system, she discovered that her actual food cost was not 33 percent. It was 43 percent. The difference was $4,200 per month in hidden waste that had been invisible in the aggregated numbers.
This deep dive walks through how Elena built her recipe costing system, what she found, and how she recovered $50,000 in annual profit by closing the gap between theoretical and actual food cost.
Every Recipe Has a Theoretical Cost
The foundation of food cost control is knowing what each dish costs to produce. This sounds obvious, but the number of restaurants that operate without accurate recipe costs is surprising. According to a 2024 survey by the National Restaurant Association, only 38 percent of independent operators calculate recipe costs regularly. The rest use guesswork, benchmark percentages, or simply hope for the best.
The Anatomy of a Recipe Cost
Calculating a recipe cost involves more than adding up ingredient prices. Here is what goes into each dish:
Ingredient cost: The price paid for each ingredient. This seems simple, but ingredient prices fluctuate weekly. A restaurant using last month's prices for this month's costing is building on outdated data.
Yield percentage: Not all of what you buy ends up on the plate. A head of lettuce might yield 75 percent after trimming and discarding outer leaves. A whole beef tenderloin might yield 60 percent after trimming fat and silver skin. Recipe costs must account for these losses.
Portion size: The exact amount of each ingredient used in the standardized recipe. This requires measuring and weighing, not estimating.
Waste and trim: Some waste is unavoidable — vegetable peels, meat trimmings, bones. But some waste is a sign of poor preparation practices or over-portioning by kitchen staff. A good costing system separates unavoidable waste from controllable waste.
Seasonal variation: Asparagus costs differently in March than it does in August. A recipe cost that does not account for seasonal fluctuation will be wrong for half the year.
How Elena Was Costing Before Mica
Before Mica, Elena's costing process was manual and infrequent. She would sit down every quarter with supplier invoices and a calculator. She would look up what she paid for each ingredient, estimate the portion sizes based on her memory of the recipe, and write the cost on a paper card. The process took 6 to 8 hours for a menu of 35 items. By the time she finished, the data was already three months old and partially outdated.
Building the Recipe Costing System with Mica
Elena opened Mica and typed:
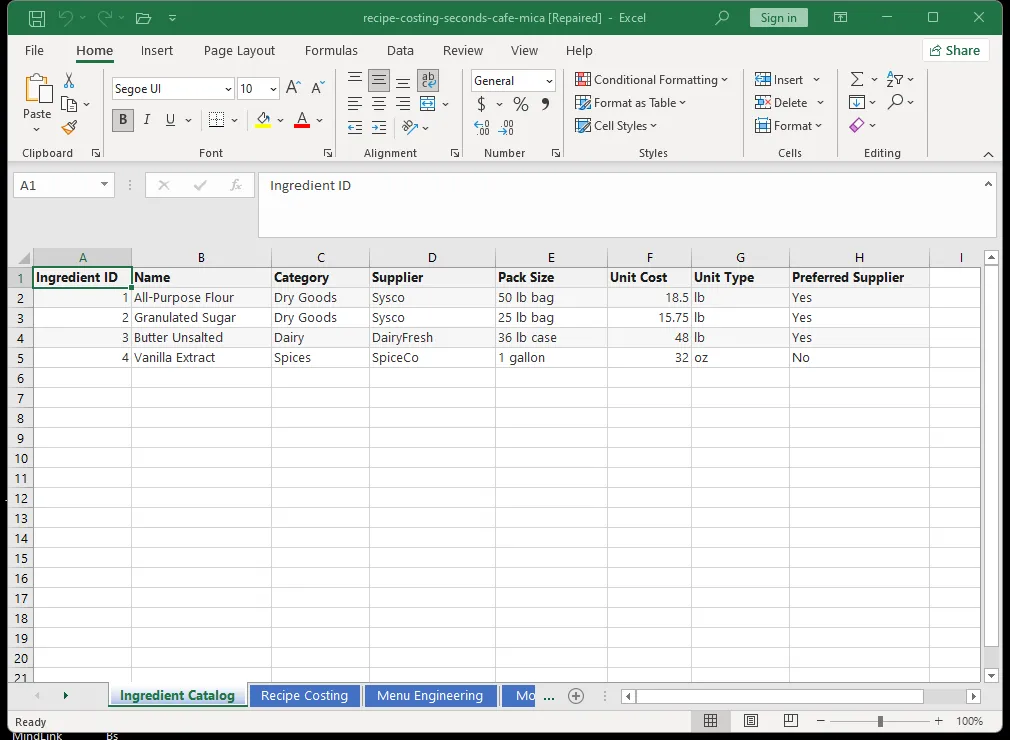
"Build a recipe costing workbook for my cafe. Sheet one should have each menu item with its selling price and target food cost percentage. Sheet two should be a detailed ingredient cost breakdown for each recipe, with columns for ingredient name, purchase unit size, purchase price, yield percentage, portion size used per dish, and cost per portion. Sheet three should calculate the total recipe cost for each dish and compare it to the selling price to show the actual food cost percentage and gross profit per dish. Add sample data for a breakfast cafe menu."
Mica generated the three-sheet workbook in about 30 seconds. The sample data included a breakfast burrito, avocado toast, scrambled eggs platter, and a smoothie bowl — all with realistic ingredient breakdowns so Elena could see how the costing system worked before entering her own data.
Sheet One — Menu Overview
A simple table listing every item on the menu with its selling price and target food cost percentage. Elena set targets between 25 and 30 percent depending on the category. Coffee drinks got a 25 percent target. Entrees with expensive proteins got 30 percent. This sheet became the benchmark against which actual costs were measured.
Sheet Two — Ingredient Cost Breakdown
This is where the detailed work happens. Each ingredient has its own row with:
- Purchase unit size: The package size as bought from the supplier (e.g., 50-pound bag of flour, 5-pound block of cheese)
- Purchase price: What was actually paid, updated regularly
- Yield percentage: What fraction of the purchased ingredient is usable (e.g., 80 percent for whole vegetables after trimming)
- Portion size: The exact amount used in one serving of the dish
- Cost per portion: Calculated automatically from the above fields
This sheet revealed the first surprise: Elena was using purchase prices from supplier invoices but had never accounted for yield loss. Her avocado cost calculation assumed that every avocado she bought yielded 100 percent usable fruit. In reality, avocados have pits and peels that account for about 25 percent of the weight. The yield adjustment added $0.42 to the cost of her avocado toast — a dish she sold 60 to 80 times per day.
Sheet Three — Recipe Cost Summary
The final sheet pulls everything together. For each menu item, it shows:
- Total ingredient cost per serving (sum of all ingredient costs adjusted for yield)
- Selling price
- Actual food cost percentage
- Gross profit per dish
- Variance from target food cost percentage
When Elena populated this sheet with real data, the numbers were eye-opening.
What Elena Discovered — The Hidden 30 Percent
The recipe costing system revealed that Elena's actual food cost was not the 33 percent shown on her monthly P&L. The actual cost of goods sold, calculated from recipes, was averaging 37 percent across the menu. But that was not the hidden cost. The real discovery came when she compared theoretical cost (what recipes said each dish should cost) to actual cost (what inventory data showed was being used).
The Variance Problem
The system included a variance calculation: theoretical ingredient usage versus actual ingredient usage over a given period. For the first month Elena tracked this, the variance was 6 percent. That means for every $100 of ingredients her recipes said she should use, her inventory showed she actually used $106. The extra $6 was disappearing somewhere between the kitchen and the customer.
Over a month, that 6 percent variance represented approximately $2,100 in unaccounted ingredient cost. Annualized, that was over $25,000.
Where the Variance Came From
Elena investigated the sources of variance. The recipe costing system did not tell her where the waste was occurring, but it told her to look. She found three main sources:
Over-portioning by kitchen staff: The avocado toast recipe called for one-quarter of an avocado. Staff were using one-third because it was faster to cut. That added $0.42 per serving in extra cost. With 70 servings per day, that was $29.40 per day, or $882 per month.
Trim waste not being captured: Vegetable trim from prep was supposed to go into stock. Instead, it was being thrown away. The stock was being made from fresh vegetables bought specifically for that purpose — an unnecessary duplication of ingredient cost.
Unrecorded comps and waste: When a dish was made incorrectly or sent back, the replacement dish was not tracked. The ingredients for both the failed dish and the replacement were consumed, but only the replacement was recorded as sold. The recipe costing system made this visible because the actual ingredient usage exceeded the theoretical usage.
The Recovery
Elena made three changes based on what the system showed her:
-
Trained staff on portion control. She showed them the dollar impact of over-portioning. The avocado alone was nearly $900 per month. The staff understood and adjusted. The variance dropped by half in the first month.
-
Changed the prep workflow. Vegetable trim went into a stock pot instead of the trash. Elena calculated that this change saved $120 per month in ingredients that no longer needed to be purchased separately for stock.
-
Implemented a waste tracking protocol. Any dish that was remade due to error or customer return was logged in a separate sheet. This created accountability and allowed Elena to track the true cost of quality issues.
After three months, the variance had dropped from 6 percent to under 1 percent. The total savings: approximately $2,000 per month, or $24,000 per year.
The Menu Pricing Discovery
The recipe costing system also revealed that several menu items were priced incorrectly. Elena had set prices based on what competitors charged and what "felt right." The costing data showed a different picture:
-
The popular smoothie bowl had a food cost of 22 percent — well below her target of 28 percent. The dish was underpriced by $2.50 relative to its ingredient cost. With 300 bowls sold per month, Elena was leaving $750 per month on the table. She raised the price by $1.50, which brought the food cost to 27 percent and added $450 per month in revenue with minimal customer pushback.
-
The signature breakfast burrito had a food cost of 41 percent — massively above the 28 percent target. Elena had not realized how much the protein cost had increased over the past year. She adjusted the recipe to reduce the protein portion by 15 percent (which customers did not notice) and raised the price by $1.00. The food cost dropped to 31 percent.
-
The kids' pancake plate had a food cost of 19 percent but was priced competitively. Elena left it alone — some low-cost items are valuable for customer perception even if they are not profit-maximized.
These pricing adjustments added approximately $1,800 per month in additional gross profit.
The Bottom Line Impact
Elena's total improvement from the Mica recipe costing system:
| Category | Before | After | Monthly Improvement |
|---|---|---|---|
| Average food cost | 37 percent | 30 percent | 7 points |
| Recipe-to-inventory variance | 6 percent | 0.8 percent | 5.2 points |
| Gross profit per month | $24,000 | $28,200 | $4,200 |
| Annualized profit impact | — | — | $50,400 |
The system that produced these results took 30 seconds to build. It runs on Elena's laptop. It cost nothing in software fees. And it continues to provide value every month as she updates ingredient prices and adjusts her menu.
How to Build Your Own Recipe Costing System
Any restaurant or cafe can replicate this system. Open Mica and describe your menu. Here is a starting prompt:
"Create a recipe costing workbook for a restaurant. Include three sheets: a menu overview with selling prices and target food cost percentages, an ingredient cost breakdown with yield adjustments, and a recipe cost summary showing actual food cost and gross profit per dish. Add conditional formatting to highlight any dish with a food cost above 35 percent in red."
Mica will build the workbook in under a minute. Enter your actual ingredient costs and recipe portions, and you will have a complete picture of your food cost structure. Use it to identify hidden waste, adjust pricing, and protect your margins.
Open the recipe costing template in Google Sheets →
Related Articles
Ready to let Mica handle your Excel chores?
Download for Free