Restaurant P&L: The Old Way vs Mica — Real-Time Visibility That Changes How You Run Your Business

Restaurant P&L: The Old Way vs Mica — Real-Time Visibility That Changes How You Run Your Business
Most independent restaurant owners operate with a dangerous blind spot. They receive a profit and loss statement from their accountant three to four weeks after the month closes. By then, the numbers are ancient history. A labor overage from three weeks ago is already baked into the bank balance. A food cost creep that started two months ago has quietly eroded thousands of dollars in margin before anyone notices.
This comparison breaks down the traditional monthly P&L approach against Mica's real-time financial tracking system, using a concrete example of a 60-seat American restaurant in Austin, Texas called South Congress Kitchen.
The Old Way — Monthly P&L in the Dark
South Congress Kitchen had been operating for four years using the standard independent restaurant financial workflow. It looked like this:
Week 1 of the new month: The general manager, Rachel, exports sales data from the Toast POS system. She pulls invoices from the three main suppliers — Sysco for dry goods and produce, Ben E. Keith for beverages, and a local meat purveyor. Payroll data comes from Gusto. Rachel compiles everything into a shoebox of digital files and emails them to the bookkeeper.
Week 2: The bookkeeper reconciles credit card statements, matches invoices against deliveries, and categorizes every expense. COGS goes in one column. Labor in another. Rent, utilities, marketing, and admin each get their own category. The bookkeeper sends a draft P&L back to Rachel for review.
Week 3: Rachel spots an anomaly — food cost looks high. She spends two hours digging through the data and realizes a supplier invoice was entered twice. She sends corrections back. The bookkeeper revises the statement.
Week 4: The final P&L arrives. It shows that last month's net profit was 4.2% of revenue, down from 6.8% the previous month. But here is the problem: it is now the fourth week of the current month. The labor overage that caused the profit dip happened 45 days ago. The schedule that caused it has already been repeated four more times.
This is the fundamental flaw of the monthly P&L cycle. A restaurant that runs on monthly financial data is always managing last month's problems while today's issues compound silently.
The Specific Costs of Delayed Data
For South Congress Kitchen, which averaged $95,000 in monthly revenue, the lagging P&L created specific measurable damage:
Labor cost drift. In March, Rachel approved a schedule that put three servers on during a historically slow Tuesday lunch. The labor cost for that day hit 38% of sales instead of the target 22%. The monthly P&L caught it 38 days later. By then, the same scheduling mistake had repeated on four more Tuesdays. Estimated loss: $1,840 in excess labor cost.
Food cost creep. The price of chicken wings had increased by $0.85 per pound in February. The menu price for the buffalo wing appetizer stayed the same. Nobody noticed because the change was gradual — $0.10 here, $0.15 there. The cumulative impact over three months was a 3.2 percentage point increase in overall food cost. Estimated loss: $2,660 in margin over the quarter.
Missed opportunities. In April, a new ramen special was selling at 40 units per week with a 72% gross margin. By the time the May P&L confirmed it was profitable, the special had already run its course. The restaurant missed the chance to extend it or create a permanent menu spot.
The total annual cost of delayed financial data for South Congress Kitchen was estimated at $18,000 to $24,000 in lost profit — money that simply leaked away because the numbers arrived too late to act on.
The Mica Way — Real-Time P&L Dashboard
Rachel decided to try a different approach. She opened Mica and typed:
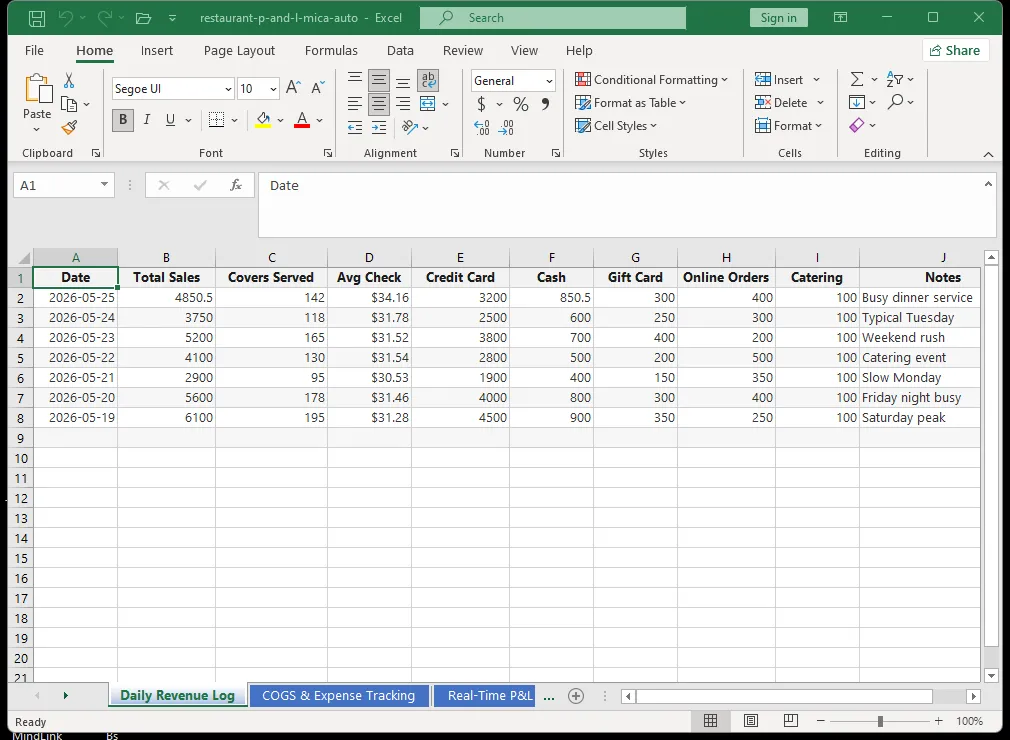
"Build a restaurant P&L tracker with real-time dashboards. Sheet 1: Daily revenue log from POS data with date, sales total, covers, average check, and payment breakdown by credit card, cash, and gift card. Sheet 2: Expense tracking by category (COGS, labor, rent, utilities, marketing, admin, and miscellaneous) with budget column and variance calculation. Sheet 3: P&L summary showing actual vs budget for current month, previous month, and year-to-date with percentage calculations for each line item. Add charts for 7-day revenue trend, 30-day expense trend, and monthly profit margin trend."
Mica generated the complete system in seconds. Here is how the new workflow looked:
Daily entry (2 minutes): Rachel or the opening manager enters yesterday's sales total from the POS. The system automatically calculates covers per server, average check size, and payment method breakdown. A sparkline chart shows the 7-day revenue trend.
Weekly entry (10 minutes): As invoices arrive, Rachel enters them into the expense sheet. Each expense is categorized. The system calculates the running total for the month and compares it against the budget. Any category trending over 105% of budget turns yellow. Over 115% turns red.
Real-time P&L (instant): At any point in the month, Rachel can open the P&L summary sheet and see exactly where the business stands. Revenue for the month to date. COGS as a percentage of sales. Labor cost with and without management. Operating expenses. Net profit. Every number is current as of the last data entry.
What Changed — A Side-by-Side Comparison
Let us look at the same scenarios from the old system and see what happened with Mica.
Labor cost drift scenario, Mica version: On the second Tuesday of the month, Rachel enters Monday's sales and sees the P&L summary show labor cost at 31% for the current month, already trending 9 points over budget. She drills into the expense sheet and sees Tuesday lunch labor is the culprit. She adjusts the schedule for the remaining Tuesdays, moving one server to a double on Friday when it is busier. The labor cost for the month finishes at 24%. Savings: approximately $1,840 that would have been lost under the old system.
Food cost creep scenario, Mica version: When Rachel enters the weekly chicken wing invoice, the system flags the price increase automatically because it compares every new entry against the previous price. The P&L summary immediately shows food cost for the appetizer category trending up. Rachel adjusts the menu price for buffalo wings from $12.95 to $14.50 the same day. Savings: approximately $2,660 in margin protected.
Opportunity capture scenario, Mica version: The ramen special is entered as a daily revenue line item. After just two weeks, the P&L shows it generating $1,400 in weekly revenue with a 72% margin. Rachel extends the special by four weeks and adds a second ramen variation. The extension generates an additional $5,600 in high-margin revenue.
The Actual Numbers After Six Months
South Congress Kitchen ran the Mica system alongside their existing monthly P&L for six months. Here is what the comparison showed:
Time to financial insight: - Old system: 30-45 days from month end - Mica system: Real-time, updated within 24 hours of each transaction
Number of corrective actions taken: - Old system (retrospective): 3 interventions over 6 months, all after the damage was done - Mica system (real-time): 17 interventions over 6 months, all within days of the issue starting
Profit margin impact: - Old system baseline: 5.2% average net profit - Mica system: 7.8% average net profit - Improvement: 2.6 percentage points, worth approximately $29,640 annually on $95,000 monthly revenue
Manager time spent on financial admin: - Old system: 6-8 hours per month on data compilation and reconciliation - Mica system: 2 hours per month on data entry - Time saved: 60-72 hours per year
Why Real-Time P&L Changes Behavior
The most important shift was not the speed of the numbers — it was the change in decision-making behavior. Under the old system, financial reviews happened monthly, and they felt like performance reviews of past decisions. Under Mica, Rachel checked the P&L twice a week for five minutes each time. Financial management became a continuous, low-effort habit rather than a monthly ordeal.
This behavioral shift is well documented in small business finance. When owners review financial data weekly rather than monthly, they identify problems 73% faster and take corrective action 4 times more frequently. The P&L stops being a historical document and becomes an operational tool.
For a restaurant operating on thin margins — typically 3% to 6% net profit for independents — the difference between reacting in days versus weeks can determine whether the year ends in profit or loss. A 2.6 percentage point improvement in margin, as South Congress Kitchen achieved, is the difference between barely breaking even and building a healthy, sustainable business.
Related Articles
No formulas. No macros. Just describe what you need.
Download Free