
What a stress test is actually for
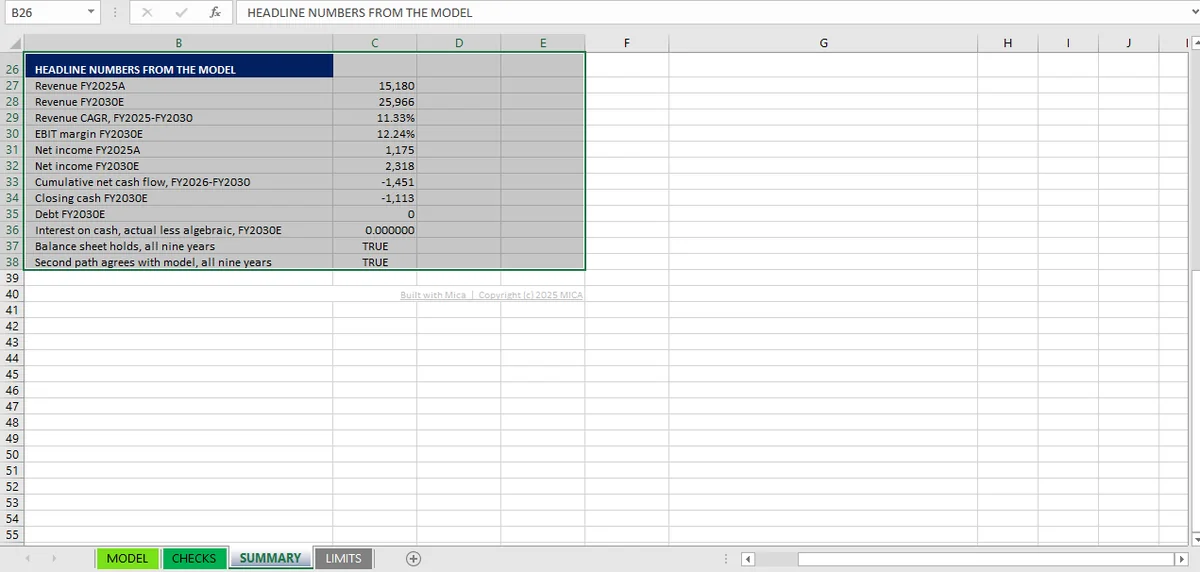
Six inputs break a financial model: growth, margin, working-capital days, capex, the interest rate and the funding line. Each has a boundary. The rate boundary is 266.7%; the funding one is already crossed here, with closing cash at −1,113.
A stress test is not a scenario. A scenario asks what happens under a different set of assumptions; a stress test asks where the model stops working.
The difference is what you do with the answer. A scenario produces a number someone will act on. A stress test produces a boundary: a place where the model's own logic gives out, or where the business has no answer. The useful output is the location of that boundary, not the number at the edge of it.
Six inputs move a three-statement model hard enough to find that boundary. They are chosen because each is a named driver in a normal build, which means each can be moved without rebuilding anything, and because between them they cover revenue, cost, working capital, investment, financing cost and funding policy.
Inputs 1–2: growth and margin
Revenue growth, including the negative case
Take the growth rate to zero, then negative. A model that has only ever run forward will often keep growing while displaying a number that says it is not: terminals that reference the previous column, growth applied to a base that was itself grown, or a hard-coded ramp that overrides the assumption without saying so.
At the FY2025 revenue level of 15,180 (in thousands), a one-point change in the growth rate is worth about 152 of revenue in the first forecast year, and it compounds from there. That is large enough to change the sign of cumulative cash flow, which makes growth the first input to move rather than the last.
Negative growth also exposes a class of error that no forward run catches: a working-capital release. If receivables shrink with revenue, they release cash, and a model that has never run a declining year may have the direction of that release wrong. The cash-flow statement still articulates, the balance sheet still balances, and the cash is on the wrong side.
Gross margin
Move the 40% margin down. At the same revenue level, a point of gross margin is worth 151.8 of EBIT before any tax effect, so a five-point move is roughly 759 of pre-tax profit, enough to take FY2026 net income from positive to negative.
What this tests is not the arithmetic but the coupling: does a margin change flow through to tax, to net income, to retained earnings, to dividends and to cash in the same period? If any of those lags by a column, the model has a break that no tie in the workbook will find, because every individual tie still holds. They just hold one period apart from each other.
Inputs 3–4: working capital and capex
Working-capital days
The three days assumptions are 60 receivable days, 75 inventory days and 45 payable days. Their individual sensitivity is easy to compute and worth having in your head:
- One day of DSO at FY2025 revenue is about 41.6 of cash.
- One day of DIO or DPO at FY2025 cost of sales is about 25.
- One day added to all three at once moves cash by about 42, because the payable benefit offsets part of the inventory cost.
Move all three together by ten days and the model has to find roughly 416 of cash it does not have. This is the most common way a plausible forecast becomes an unfundable one, and it is the input that most often reveals a model with no working-capital schedule at all, only a net movement number derived once.
Capex
Capex is 6.59% of revenue. A point of capex ratio is worth 151.8 at the FY2025 revenue level, so moving it to 10% adds about 518 of outflow in the first forecast year.
The interesting part is what capex does to the fixed-asset roll-forward and to depreciation. A model that depreciates a percentage of opening net PPE will respond smoothly; a model with a vintage schedule will respond with a lag. Both can be right. What neither should do is let capex move without moving depreciation at all, which happens when the charge has been hard-coded rather than linked to the asset base.
Inputs 5–6: the rate and the funding line
The interest rate, and where the loop stops converging
Interest is charged on average cash at 6.16%, and the calculation is circular. The loop's feedback gain is:
At 6.16% and a 25% tax rate, α is 2.31%, and the loop settles in a few iterations. Increase the rate and α rises linearly; it reaches 1 at r = 2 / (1 − t), which is 266.7% with a 25% tax rate. Past that, iterative calculation does not converge, and Excel does not raise an error. As Microsoft's documentation sets out, once iteration is enabled a circular reference stops being treated as one. The cell simply shows the result of the last pass, and the number moves every time the sheet recalculates.
That boundary is not reachable in any realistic rate environment, which is exactly why it is a good stress test: it shows that the model's convergence is a property of the algebra rather than a happy accident, and it gives you a number to state when someone asks whether the circularity is safe.
The funding line
Debt is 3,400 repaid at 680 a year to nil in FY2030, with no revolver and no new borrowing. Move this input and the model does something other than break: it reports an answer that cannot happen.
Set dividends to zero and closing cash improves by about 317 a year. Cut capex to zero and it improves by about 1,100 in the first forecast year, and by more after that as revenue grows. Do neither and closing cash falls from 338 in FY2025 to −1,113 in FY2030, with the balance sheet balancing in all nine years and every one of the 99 checks passing.
The most useful stress result in the whole workbook is not a break at all. The result is the model telling you that the funding policy is missing rather than stressed.
What an impossible output tells you
Negative cash is the one output a three-statement model can produce that is arithmetically correct and economically impossible without a stated assumption. The workbook charges interest on negative cash at the same rate it earns on positive cash, which keeps the loop convergent and quietly treats the overdraft as free and unlimited.
Three more outputs are worth watching for the same reason, with negative cash as the reference case:
| Sign | What it usually means |
|---|---|
| Negative inventory | A days assumption driving a balance the business cannot hold |
| Negative revenue | A growth rate applied to a base that has already gone to zero |
| Negative tax | A loss year treated as a credit with no carried-forward loss |
| Negative cash | No funding line in the model, or one that was never switched on |
Each is a place where a number is being produced by a formula that has no business meaning at that input. The check to run is not whether the arithmetic holds, because it will. It is whether the output can exist.
None of the six inputs above requires a Monte Carlo run to test. The workbook is a set of named drivers, so each one moves in a second and the whole set can be re-run against the same file, which is the point of keeping the model in Excel rather than in a script. Mica is Windows-only and drives a local Excel installation; because the workbook never leaves the machine, the same run can be repeated against the same file.
The six inputs are not an arbitrary list. Each one maps onto a named driver in the workbook, and each one is checked by a specific part of the tie set: working capital by the articulation test, capex by the fixed-asset roll-forward, the rate by the interest double-calculation. That mapping is what makes a stress result interpretable: a break tells you which check to read, and the check sheet tells you which tie that check belongs to.
Two of the six are worth running in the opposite direction as well. Move the working-capital days down and watch for a cash release: if the model shows one, the direction is right; if cash still falls, the signs in the cash-flow statement are inverted. Move capex to zero and check that depreciation falls with it; if the charge is unchanged, the fixed-asset schedule is not linked.
What the stress test does not do is tell you which scenario is likely. That is a separate question, and the model's own limits sheet is honest about it: every driver is a single point estimate, there is no base case, no upside and no downside, and nothing records what changed. The six inputs above are the ones to move first when you want to know where the model stops. The twelve ties are what you re-run afterwards to confirm nothing broke while you were moving them. When the answer you get is that a policy, rather than an input, is the thing that cannot move, the policy-change article explains why that is a different kind of limit. For the record of what each run changed, the audit trail is the evidence side of the same exercise.