
Three-statement model: what the two PDFs became
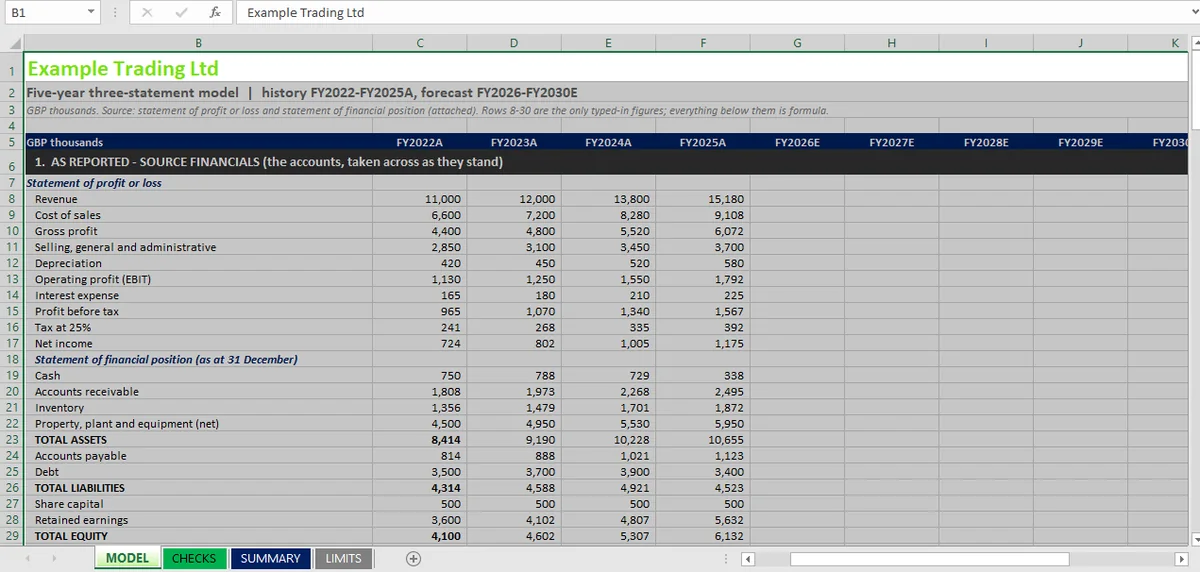
The case. Two PDFs went in: four years of accounts for a synthetic company, FY2022–FY2025, a statement of profit or loss and a statement of financial position, in thousands. No cash-flow statement, no forecast, no assumptions sheet, and no answer key. The model had to derive the cash flow from the two statements, make the balance sheet hold in every year, and roll five years forward to FY2030 on drivers inferred from the history. The figures were typed from the PDFs; none of the 99 checks compares a typed figure back to the PDF. This is a synthetic case for method demonstration, not investment, tax or legal advice.
A three-statement model built from two PDFs was checked by 99 checks against itself: 99 passed, 0 failed. Closing cash still falls to −1,113 because nothing funds the shortfall. The sheet proves the statements are joined, not that the business works.
The 99 checks are a consistency result, not an accuracy result: none of them compares a source PDF to the figure that was transcribed from it.
The instruction was one page. Take the accounts across as they stand; rebuild the cash-flow statement for each year from the P&L and the balance sheet alone; make the balance sheet hold in every year, with one cell per year that reads TRUE when it does; then roll five years forward on the economics the accounts already show. No margin, no growth rate, no working-capital days and no capex figure were supplied. Each of those had to be inferred from four years of statements and placed in a named cell that could be changed later. The answer key was withheld until after the build, so there was nothing to copy.
What came back is a single workbook with four sheets. MODEL holds nine columns: four historical years transcribed from the accounts, five forecast years rolled forward on the drivers the history implies. CHECKS holds one row per check. SUMMARY counts them with live formulas rather than typed totals. LIMITS lists eighteen things the model does not cover, several of which are material to the answer.
| Measure | Result |
|---|---|
| Model | Three-statement model, synthetic company, FY2022–FY2030 |
| Checks | 99 |
| Passed | 99 |
| Failed | 0 |
| Closing cash, FY2030E | −1,113 (thousands) |
| Tolerance | 0.01 |
The last two rows sit next to each other on purpose. Every arithmetic check passes, and the forecast runs out of cash.
What the 99 checks show
The 99 checks fall into twelve families, and the families map onto the twelve ties a three-statement model has to hold. Reproducing the SUMMARY sheet:
| Check family | Checks | Passed |
|---|---|---|
| Balance sheet identity (history) | 4 | 4 |
| Balance sheet identity (forecast) | 5 | 5 |
| As-reported totals | 8 | 8 |
| P&L arithmetic (history) | 16 | 16 |
| P&L arithmetic (forecast) | 5 | 5 |
| Cash flow articulation (history) | 3 | 3 |
| Cash flow articulation (forecast) | 5 | 5 |
| Roll-forwards (history) | 6 | 6 |
| Roll-forwards (forecast) | 10 | 10 |
| Interest: iterative vs algebraic | 10 | 10 |
| Second path: balance sheet identity | 9 | 9 |
| Second path vs model | 18 | 18 |
| Total | 99 | 99 |
Three of those families carry more weight than their row count suggests.
One family has fewer historical checks than the others, and that is disclosed rather than hidden. Cash-flow articulation has three historical checks, not four, because FY2022 has no opening balance sheet in the source pack. The model reports FY2022 as n/a instead of assuming zero opening balances and calling the difference a cash flow. A model that invents an opening balance passes the same tie while being wrong by the whole of the first year.
Interest is computed twice. The live forecast charges interest on average cash, which is circular: cash depends on interest received and interest received depends on cash. The workbook turns on iterative calculation, then prices the same interest again by solving the loop algebraically, and subtracts. Ten checks, two per forecast year. The largest difference across all of them is 5 × 10⁻¹³ in thousands. The circular reference article goes through why that loop used to be the thing AI tools could not build.
The second path is 27 checks and it is the only part of the workbook built as a separate path — independent of the model's calculations, though not of its drivers. Nine checks test that a separately built block of columns balances on its own; eighteen more test that it agrees with the model line by line, in all nine years. It refers only to the original figures and the named drivers, never to anything the model calculated. Without it, the other 72 checks are the model agreeing with itself. How those checks are written into the file is the subject of the workbook-agent guide.
Where the drivers came from
A forecast is a set of assumptions, and the useful question about an AI-built one is whether the assumptions were inferred from the documents or supplied alongside them. In this build every driver below came out of the statements:
| Driver | Value used | Where it came from |
|---|---|---|
| Gross margin | 40.00% | Identical in all four historical years |
| DSO / DIO / DPO (days sales, inventory and payable outstanding) | 60 / 75 / 45 days | Constant across the historical years, measured on closing balances |
| Capex | 6.59% of revenue | The FY2025 ratio |
| Depreciation | 10.49% of opening net property, plant and equipment (PPE) | Implied by the historical charge |
| Tax | 25% of profit before tax | Printed on the face of the P&L |
| Interest rate | 6.16% | FY2025 interest over average FY2024/FY2025 debt |
Two drivers could not be inferred and were specified instead, because the history does not contain a stable rule. Dividends run 300, 300 and 350 across the three observable years, so the model uses an average of 316.67; debt rises by 200 in each of the first two years and falls by 500 in the third, so the forecast amortizes evenly at 680 a year to nil in FY2030. Those are choices an analyst would have to make anyway. The difference is that they are named cells with the reasoning recorded next to them, rather than numbers embedded in a formula. If you want the same cash-flow build taken from assumptions rather than accounts, the DCF walkthrough starts there.
The one number that matters
Closing cash goes 788, 729, 338, then −140, −537, −841, −1,039, −1,113.
Revenue grows at 11.33% a year, from 15,180 in FY2025 to 25,966 in FY2030. Net income doubles to 2,318. Total assets rise from 8,414 to 15,571. Every ratio looks like a healthy business, and the business cannot fund itself: capex, 680 a year of debt repayment and roughly 317 of dividends exceed what it generates, and there is no revolver, no new debt, no equity raise and no dividend cut in the model.
The workbook charges interest on negative cash at the same rate it earns on positive cash, which is why the loop still converges. Economically that is an overdraft nobody arranged. This is the difference between a model that ties and a model that is right: no check in the 99 asks whether the funding policy exists, because a missing decision is not an arithmetic error. If you want the same discipline applied to a project appraisal, the corporate-finance topic is the next step.
What each article in this topic covers
The twelve ties are the spine, with the checks behind each one. When the balance sheet will not balance is the diagnostic order to work through when one of them breaks. The audit trail covers what an AI-built file leaves behind for the next person. Changing one accounting policy is the linkage test: every schedule that has to move when one method changes. Stressing the drivers covers what breaks first when an assumption goes somewhere plausible but uncomfortable. The self-checking model is the construction view: what has to be true of the build itself for the checks to be possible at all.
Where the workbook stops
The limits, in order of how much they matter.
It is a cross-check, not an audit. Both the model and the second path were built by the same agent from the same source documents. Where they share a driver, an error in that driver moves both together and the 27 second-path checks will not see it. What the checks establish is that the statements are joined and the arithmetic is internally consistent, not that the drivers are right. That is why the checks are described as model validation rather than assurance, and why the six check types include two that compare methods rather than compare against a benchmark.
One scenario, no sensitivity. Every driver is a single point estimate: a 40% gross margin, 60/75/45 working-capital days, capex at 6.59% of revenue, depreciation at 10.49% of opening net PPE, a flat 25% tax rate and a single blended interest rate of 6.16%. There is no base case, no upside, no downside and no data table. The drivers are named cells, so changing one is trivial; nothing records what changed or what it moved.
The source figures are taken at face value. Four years of accounts transcribed as printed, rounded to the nearest thousand, with no adjustment for a financing policy that is itself inconsistent: debt rises by 200 in each of the first two years and falls by 500 in the third. The model reproduces that rather than explaining it.
The LIMITS sheet lists eighteen of these, and three are material rather than housekeeping: the funding gap already described, the missing FY2022 opening balance, and a single blended interest rate applied to both debt and cash when a real facility would pay and earn different rates. The rest are ordinary modeling boundaries: no deferred tax, no asset disposals, no seasonality, no statement of changes in equity, a 365-day year, no part-periods. Writing them down is part of the work rather than an admission about it: a model that does not state its boundaries invites the reader to assume it has none.
It is not investment advice, and the company is not real. The document set states that it is synthetic. Nothing here is a filing, a disclosure or a basis for a decision, and the workbook says so on the LIMITS sheet.
What would change the conclusion is not another check. It is a funding policy: a revolver, a dividend cut, or a capex deferral. Each of those would move closing cash, and each would need its own schedule and its own tie. Until one exists, the honest reading of this workbook is that the statements hold and the plan does not.
The file came together in a local Excel session through Mica, with every identity re-checked as the forecast recalculated.
Common questions
How do you check whether a three-statement model is correct?
Work through the twelve ties that make the statements articulate: the balance-sheet identity in every period, both reported sides, four income-statement lines, cash flow articulation, the three roll-forwards, interest computed twice, and a second path. This workbook runs 99 checks across those ties, and all 99 pass.
Why is my balance sheet not balancing?
The usual causes are a cash-flow line that does not articulate, retained earnings that miss net income less dividends, or a roll-forward that opens on the wrong closing balance. Check those three in that order before touching a formula. In this build the balance sheet holds in all nine years, and closing cash still turns negative.
Why is closing cash negative if every check passes?
Because no funding line exists. Capex, 680 of annual debt repayment and roughly 317 of dividends exceed cash generated, and nothing in the model borrows, defers capex or cuts the dividend.
Is this an external audit?
No. It is a cross-check inside one workbook, built by the same agent from the same documents; 27 of the 99 compare a second build that shares the drivers.