

Equity valuation: four methods on one company
The case. The company is the same synthetic company used in the three-statement workbook, valued in the same thousands: four historical years, FY2022–FY2025, and a five-year forecast to FY2030. Book equity at 31 December 2025 is 6,132; the company pays out 29.8% of earnings; the WACC is 8.5%, the cost of equity 10.81%, and the after-tax cost of debt 4.33%. Four methods are applied to that one forecast: free cash flow to the firm (FCFF), free cash flow to equity (FCFE), a multi-stage dividend discount model (DDM) and residual income. The four years of accounts were transcribed from a sample document, some after more than one OCR pass; the 54 checks test the consistency that follows, not the transcription. This is a synthetic case for method demonstration, not investment, tax or legal advice.
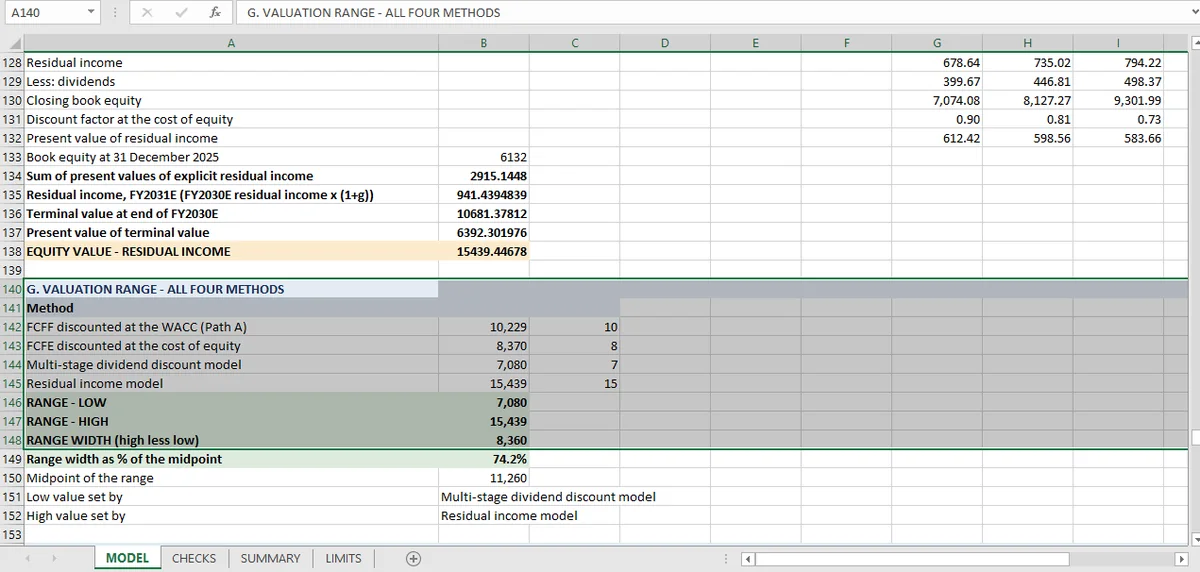
Four methods value the same company between 7,080 and 15,439, a 74% range. The spread is not arithmetic error: the DDM implies a 2.85% terminal return on equity, residual income implies 17%, and both are disclosed.
| Method | What it discounts | Value of equity |
|---|---|---|
| FCFF at the WACC | Free cash flow to the firm | 10,229 |
| FCFE at the cost of equity | Free cash flow to equity | 8,370 |
| Multi-stage DDM | Dividends | 7,080 |
| Residual income | Earnings above a charge for book equity | 15,439 |
The range is 7,080 to 15,439: a width of 8,360, or 74.2% of the midpoint. Book equity at 31 December 2025 is 6,132, so the midpoint carries an 83.6% premium to book. All values in this topic are rounded to the nearest unit; differences are computed from the unrounded figures, which is why subtracting the displayed numbers can differ by one.
Fifty-four checks back the workbook. Twenty-five test the historical build, fourteen the forecast, five the financing identity, and ten the valuation outputs themselves. All pass.
The checks prove each method is internally consistent. They cannot choose the terminal assumption; the 74% range is the honest output.
What 54 valuation checks verify
The 54 checks verify four things: the historical build (25 checks), the forecast (14), the financing identity between FCFF and FCFE (5), and the valuation outputs themselves (10).
History (25 checks). The balance sheet balances in all four historical years, the components add up, the tax rate is 25% of profit before tax, and the roll-forwards move as they should. Five more test that the drivers are stable: receivable days, inventory days, payable days, cost of sales percentage and the depreciation rate are each compared at the two ends of the history and found constant to within a rounding difference.
That last group is the quiet one. A valuation is a forecast of a business that behaves like itself, and the checks establish that it did: 60.0/75.0/45.0 days and a 60.0% cost of sales in FY2022 and again in FY2025.
Forecast (14 checks). The forecast balance sheet balances in all five years, and each line is tied back to its named driver: revenue growth of 10%, interest at the cost of debt on opening debt, capex at 6.59% of revenue, depreciation at 10.49% of opening net PPE, working capital re-derived from days.
The financing identity (5 checks). FCFF equals FCFE plus after-tax interest minus net borrowings, in each of the five forecast years. This is the bridge between the first two valuation methods, and it is checked rather than assumed.
The valuation outputs (10 checks). Each method's value is rebuilt from its own components (enterprise value less debt, explicit period plus terminal value, book equity plus residual income), and the range is checked against its own endpoints. Two are one-sided tests of sanity: the terminal value is below 80% of enterprise value (it is 76.2%), and the cost of equity exceeds the after-tax cost of debt (10.81% against 4.33%). Those rebuilds are laid out cell by cell in the Excel-for-finance guide.
Why the four valuation methods differ
Not because the arithmetic disagrees. The methods disagree because each one embeds a different assumption about what happens after FY2030, and the workbook states each assumption in its limits sheet.
The DDM is the lowest at 7,080. It discounts dividends, and the company pays out 29.8% of earnings. The cash it retains earns nothing in this model, because there is no excess cash on the balance sheet. So the DDM values the distribution policy, not the business. Its terminal stage keeps that 29.8% payout while growth falls to 2%, which implies a terminal return on equity far below the 10.8% cost of equity. It is deliberately a conservative boundary.
Residual income is the highest at 15,439. It starts from book equity and adds the value of earnings above a charge, and its terminal assumption compounds residual income at 2% forever. The assumption implies roughly a 17% return on equity in perpetuity, against a 10.8% cost of equity. It is the most generous assumption in the workbook, and it is the reason this method sets the top of the range.
FCFF and FCFE sit in between and do not agree with each other. The FCFF path gives 10,229 of equity value; the FCFE path gives 8,370. Both discount the same business, and the gap of 1,858 is the subject of the convergence article. For the project-level version of the same DCF logic, see the capital appraisal.
The useful conclusion is not that one method is right. It is that a valuation range of this width is a statement about terminal assumptions, not about forecasting skill, and that a reader who wants a single number has to choose an assumption rather than an average. For the cash-flow side, the DCF walkthrough is the worked example.
The other valuations
Two DCF routes that should meet sets out the 1,858 gap between FCFF and FCFE and why the cash flows reconcile while the valuations do not. The three-stage dividend model covers the payout assumption that puts the DDM at the bottom of the range. Residual income covers the terminal assumption that puts it at the top. Comparable multiples is the market anchor this workbook does not have. The sensitivity grid shows how far the answer moves within one method. The range article is the assembly, and why averaging the four would be worse than reporting them.
What a 74% valuation range cannot tell you
A 74% range cannot say which terminal assumption is right, what a buyer would pay, or how far the answer moves within one method. Six limits matter more than the rest, and the workbook states eighteen.
No market cross-check. There are no trading comparables, no precedent transactions and no share price test in the model. Nothing in the workbook anchors the output to what a buyer would pay. The comps article explains what that would add.
No sensitivity. One point estimate per driver, no scenarios, no data table, no probability weighting of the four methods. The sensitivity article covers what a heatmap would have to satisfy.
Financing is static. Debt is held at 3,400 for all five years, with no refinancing, amortization or new borrowing. That is the reason FCFF and FCFE diverge, and it is stated as a limit rather than fixed.
Cash is operating liquidity, not excess cash. The cash build implied by a 29.8% payout sits on the forecast balance sheet earning nothing. Adding it at face value would raise every equity value.
Terminal value carries the answer. It is 76.2% of enterprise value in the FCFF path, under the workbook's own 80% threshold. That threshold is what stops a terminal value from being the whole valuation while pretending to be a detail.
The company is not real. Four years of a sample document, unaudited and not diligenced. Every number here demonstrates a method; none of it values a business anyone can buy.
The plain conclusion is that the range is the finding. A valuation that says 7,080 to 15,439 has told you the business is worth somewhere between a conservative dividend policy and a generous perpetual return, and that the difference is a modeling choice you are required to make.
Each valuation block is built in the same Mica workbook, which turns the range into four live numbers rather than four files.
Frequently asked questions
Why do DCF, DDM and residual income give different valuations?
Because each method makes a different terminal assumption about what the business earns after the forecast. On the same forecast, the DDM here implies a 2.85% perpetual return on equity while residual income implies about 17%, and the four methods span 7,080 to 15,439.
How wide should a valuation range be?
Wide enough to show the decision, not so wide that it says nothing. Here four methods on one forecast produce a range 74% of the midpoint; the range is the finding, and averaging the four into one number would hide the disagreement.
Which valuation method is most reliable?
The one whose terminal assumption fits the business. A stable dividend payer suits a DDM; a firm that reinvests heavily and pays little suits residual income or a free-cash-flow model. That is a modeling choice, not a recommendation about any security. Running several methods is a check on the assumption, not a vote to be averaged.
Is there a market cross-check?
No. The workbook contains no comparables or transaction data, and its limits sheet says so.