
Four numbers, one range
Four methods produce 7,080 to 15,439 on one company. Averaging to 10,280 would describe no method and no assumption. The range is the finding, and its width measures how much the terminal assumption is worth.
| Method | Equity value |
|---|---|
| Multi-stage DDM | 7,080 |
| FCFE at the cost of equity | 8,370 |
| FCFF at the WACC, less debt | 10,229 |
| Residual income | 15,439 |
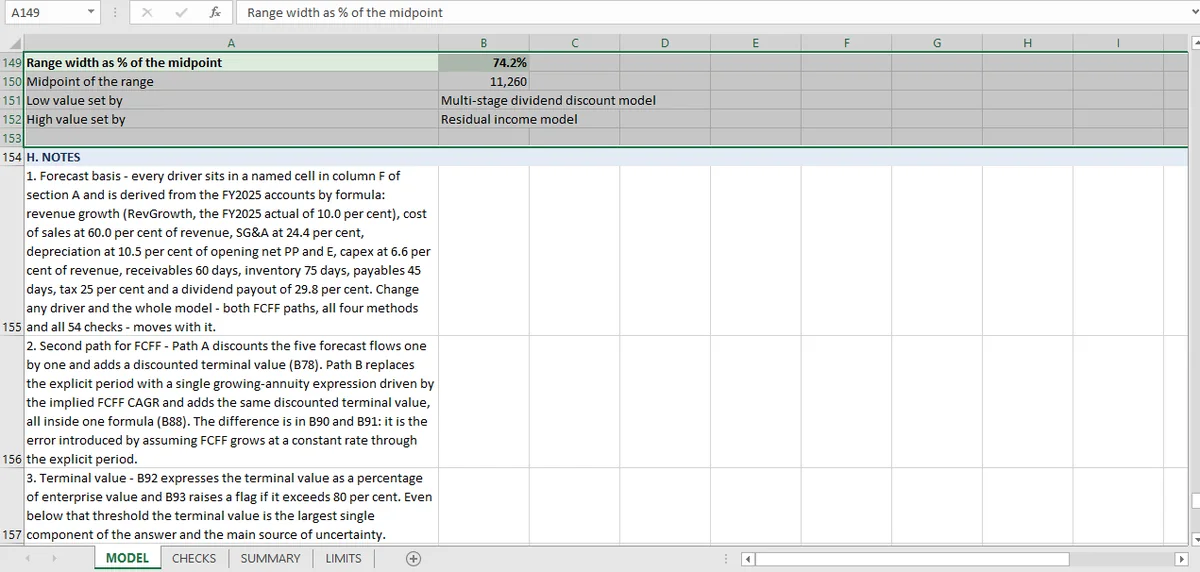
Low 7,080, high 15,439, width 8,360. That is 74.2% of the midpoint of 11,260. Book equity is 6,132, so the midpoint is an 83.6% premium to book. All values here are rounded to the nearest unit; differences use the unrounded figures, so subtracting the displayed numbers can differ by one.
A range that wide is not a failure to decide. It is the honest output of four methods that embed different assumptions, and the workbook reports the range rather than a mean instead of averaging it away. The limits sheet states explicitly that there is no probability weighting of the four methods.
Why Averaging the Four Methods Would Be Worse
Averaging hides that the four methods embed different assumptions.
The obvious response to four numbers is to take the mean: 10,280. The mean corresponds to no method and no assumption. It would be reported with the same confidence as any single value and would hide the fact that the highest and lowest differ by a factor of two.
Weighting is not much better here. To weight, you need a view on which terminal assumption is right, and if you have that view you should apply it to the model rather than to the average of its outputs. A 25% weight on each is a statement that the terminal ROE is equally likely to be 2.85% and 17%, which is not a statement anyone would defend out loud.
So the range stays a range, and its width is the finding: this business is worth somewhere between the value of its dividend policy and the value of a sustained 17% return on equity.
What each method is actually saying
Each value answers a different question; which one to quote depends on the question, and the model reports all four rather than choosing one.
7,080, the DDM. What is the distribution worth if the payout never changes and retained cash earns nothing in the model? A floor for a minority holder who only receives dividends.
8,370, FCFE. What is the equity worth if the business keeps its current debt and the cost of equity is 10.81%? The most direct cash-flow answer, and the lowest of the two DCF routes.
10,229, FCFF. The same business, valued at the WACC and with debt subtracted. Higher than FCFE because the two routes are not reconciled. The convergence article sets out the 1,858 gap and why the cash flows reconcile while the valuations do not.
15,439, residual income. Book value plus the present value of earning 17% on equity forever. The most generous terminal assumption in the workbook, stated as such.
Read that way, the range is not four opinions about the same quantity. It is one quantity under four different assumptions about what happens after FY2030, and the spread is a measure of how much that assumption is worth.
The checks that keep a range honest
Four things stop a range from becoming a place to hide.
Every value is rebuilt from its own components. Ten valuation checks recompute enterprise value less debt, explicit period plus terminal, book plus residual income, and the range endpoints. A number that cannot be rebuilt is a number that has not been checked. That proves the arithmetic, not the terminal assumption; the 74% range is the evidence.
Terminal value is capped relative to enterprise value. The FCFF terminal is 76.2% of enterprise value against an 80% threshold. A valuation that is 95% terminal value is a forecast of perpetuity with a rounding error of forecast attached, and the check refuses it.
Cost of equity above cost of debt. 10.81% against 4.33%. Trivial as arithmetic, and the first thing that breaks when a cost of capital is assembled by hand.
Payout below 100%. 29.8%, against a ceiling of 100%. A model that pays out more than it earns is either using a different earnings definition or is wrong.
None of those checks says which method is right. They say that each number is what it claims to be, which is what makes the range interpretable rather than merely wide.
How to Narrow the Valuation Range
Three routes, in order of how much they would help.
A market cross-check. A peer multiple set would put the range next to what buyers actually pay, which is the anchor this workbook lacks entirely. The comps article covers what that requires.
One terminal assumption applied to all four. If the terminal ROE, growth and reinvestment were consistent across methods, the range would contract sharply. The contraction would be evidence rather than a relief.
A sensitivity grid. The heatmap shows that at 8.5% WACC, one point of terminal growth is worth 2,009 of equity value. The range is not only a disagreement between methods; it is roughly the width of a plausible assumption set within one method.
Until one of those exists, the defensible statement is the one the workbook supports: a range of 7,080 to 15,439, every value checked, every terminal assumption stated, and no market test at all. That is a weaker claim than a single number and a much stronger one than a single number with no evidence behind it. The method at the bottom of the range has its own article on the dividend discount model, the one at the top on residual income, and all 54 checks are collected in the valuation hub.
All four valuations stay live in one Mica workbook, so the range updates when any assumption does.