
Two routes that are supposed to meet
FCFF and FCFE value the same equity at 10,229 and 8,370. The cash flows reconcile to 10⁻¹³; the valuations do not, because the cost of equity is built from book weights and the terminal blocks differ.
Free cash flow to the firm discounted at the WACC gives enterprise value; subtract debt and you have equity value. Free cash flow to equity discounted at the cost of equity gives equity value directly. Both are discounted cash flow, both value the same business, and in a well-specified model with a constant capital structure they should produce the same number.
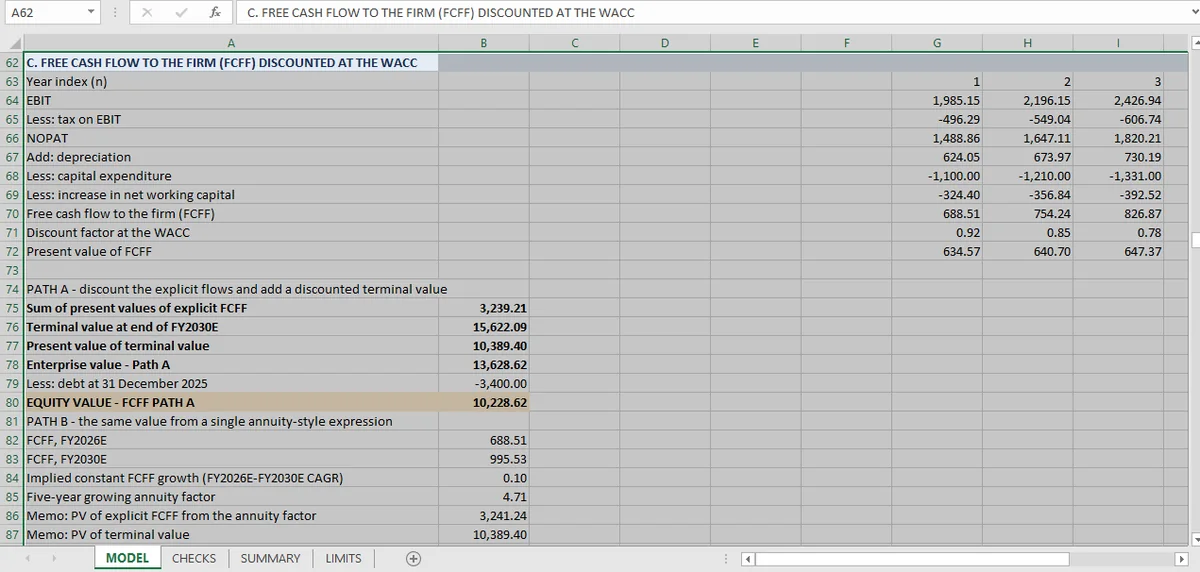
In this workbook they do not. The FCFF route gives 10,229 of equity value. The FCFE route gives 8,370. The difference is 1,858, or 18% of the higher figure.
That is not an arithmetic error, and the way to see why is to separate two things the workbook keeps distinct: whether the cash flows reconcile, and whether the valuations do.
The cash flows reconcile
Five checks test the classic financing identity, once per forecast year:
| Year | FCFF | Check |
|---|---|---|
| FY2026 | 688.51 | Identical to both sides |
| FY2027 | 754.24 | Identical |
| FY2028 | 826.87 | Identical |
| FY2029 | 907.06 | Identical |
| FY2030 | 995.53 | Identical |
The differences are at the 10⁻¹³ level. Whatever else is going on, the two models agree on how much cash the business produces and how it splits between the providers of capital. Debt is held flat at 3,400 across the forecast, so net borrowings are zero and FCFE is simply FCFF less after-tax interest.
The four years of accounts were transcribed from a sample document, and some figures needed more than one OCR pass. A dropped line can leave the balance sheet balanced if both sides move together; the 54 checks test the consistency that follows, not the transcription of the accounts.
A model that failed this identity would be broken. This one passes it and still produces two different values. Two different values out of an identity that reconciles is the interesting case.
Where the valuations diverge
Two things happen after the cash flows are computed, and both can move the answer.
The discount rates are built in a chain. The WACC is given as 8.5%. The cost of equity is derived from it using FY2025 book weights, which gives 10.81%, and the after-tax cost of debt is 4.33%. Re-deriving the WACC from those two reproduces 8.5%, and that check passes. But it is a check on internal consistency, not on the equity weight.
The limits sheet is explicit about the consequence: the cost of equity is derived using book weights, and iterating on market-value weights would lower Ke and raise every equity value. The FCFF route uses the WACC and then subtracts a fixed 3,400 of debt; the FCFE route applies Ke directly. If Ke is too high relative to the leverage actually implied, the two routes diverge in exactly the direction observed: FCFE lower.
The terminal values are built on different bases. This is the larger of the two effects. The FCFF terminal capitalizes FY2030E free cash flow at the WACC with 2% growth, but holds the FY2030E reinvestment ratios: capex at 6.59% of revenue, working capital at 60/75/45 days. The limits sheet says that combination implies a terminal return on invested capital below the 8.5% WACC, which makes the valuation conservative.
The FCFE terminal is built the same way on the equity cash flows, with the same growth and the same retention. Conservative in the same direction, but not by the same amount, because the two bases are different sizes.
A third route checks the FCFF discounting itself. The model rebuilds the enterprise value as a single annuity-style expression, separate from the year-by-year discounting, and gets 13,630.65 against 13,628.62. A gap of 2.03, or 0.015%. That check is worth having: it proves the discounting arithmetic in the FCFF path is right, which isolates the disagreement to the assumptions rather than the mechanics.
What convergence would require
Three changes, and each is a modeling decision rather than a fix.
Market-value weights in the cost of equity. Iterate until the equity weight used in Ke matches the equity value the model produces. That is a circular reference, which is why the workbook avoids it, and why most practitioners avoid it too, at the cost of exactly this inconsistency.
One terminal assumption applied to both routes. If the terminal growth, reinvestment and return assumptions are the same in FCFF and FCFE terms, the two should land together. They are not the same here, and the limits sheet says so twice.
A leverage policy that the forecast actually follows. Debt is flat at 3,400 for five years while the business grows. A flat debt policy in a growing business means leverage falls every year, which is a capital-structure assumption that neither route reflects in its discount rate.
What the FCFF-FCFE Gap Means for a Reader
The gap is not a defect to be patched before publishing; it is a disclosure. Two DCF routes on the same business differ by 18%, and the reasons are named in the workbook rather than hidden in the arithmetic. A valuation range built from methods that disagree for stated reasons is more useful than one built from methods that have been tuned to agree.
What the checks establish is narrower and firmer: that the cash flows reconcile, that each route's arithmetic reproduces from its own components, and that the FCFF discounting agrees with an independent annuity expression to 0.015%. What they cannot establish is which of the two values is right, because that depends on a leverage and terminal assumption the model does not make.
The dividend discount model sits below both, for a reason that has nothing to do with arithmetic, and the range article is where the four values are assembled into a conclusion. The valuation hub holds the full 54-check sheet, and the residual income model sits at the other end of the range.
The workbook mechanics behind the two routes are in the Excel-for-finance guide, and the DCF walkthrough builds the same cash-flow row from scratch.
The financing identity stays a live check in the Mica sheet, so a gap between the two routes shows up as a row rather than a review finding.