

The Valuation Workbook Has No Sensitivity Grid
The workbook behind this topic has no sensitivity grid at all.
A valuation heatmap has to be monotone in both directions: value falls as the discount rate rises, and rises with terminal growth. Built from this model's own cash flows, one point of terminal growth is worth 2,009.
The valuation workbook behind this topic states its position plainly: one point estimate per driver, no sensitivity tables, no scenarios, no Monte Carlo. A reader gets four values and a range, and nothing about how either moves.
The omission is a limit rather than an oversight: the workbook is a check-sheet demonstration, not a risk system. The table is also the first thing an analyst would add. This article builds the missing table from the model's own cash flows and uses it to show what a sensitivity has to satisfy.
The WACC-Growth Sensitivity Grid
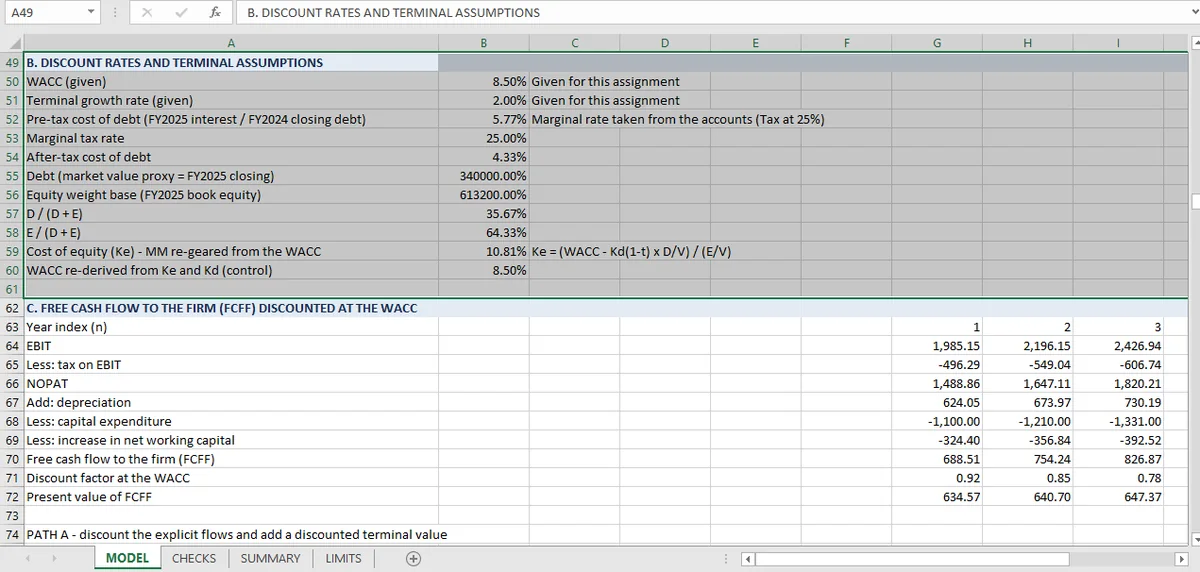
Take the FCFF path's five forecast cash flows (688.51, 754.24, 826.87, 907.06, 995.53) and a terminal value: the FY2030E flow grown at g and capitalized at WACC − g. Discount everything, subtract the 3,400 of debt, and you have equity value at any pair of assumptions.
| WACC ↓ / growth → | 1% | 2% | 3% |
|---|---|---|---|
| 7.5% | 10,706 | 12,792 | 15,804 |
| 8.5% | 8,755 | 10,229 | 12,238 |
| 9.5% | 7,265 | 8,351 | 9,772 |
The bold cell is the check that the grid is the model: at 8.5% and 2% it returns 10,229, which is the value the workbook reports. If a grid does not reproduce the base case, it is not a sensitivity of the model. It is a separate calculation that resembles one.
The Two Monotonicity Properties a Sensitivity Grid Must Obey
Monotonicity in the discount rate. Every row must fall from left to right as WACC rises. All three rows here do.
Monotonicity in growth. Every column must rise from top to bottom. All three columns here do.
Monotonicity in both directions is the minimum. A grid that violates either contains an error, and the error is usually a broken reference: one column pinned when it should be relative, or the reverse. The bug produces a table that looks smooth and is wrong in one direction, and is invisible to anyone reading the numbers instead of the formulas.
A third property is worth checking where the terminal dominates: along a diagonal of constant (WACC − growth), the values should be close, because the terminal denominator is what drives them. Here the 8.5%/2% cell is 10,229 and the 9.5%/3% cell is 9,772. They are not equal, because the explicit period is discounted at different rates, but they are close enough for the diagonal pattern to show.
What the grid shows
Two things that the single point hides.
The growth assumption moves the answer as much as the discount rate. At 8.5%, one point of terminal growth adds 2,009 of equity value (10,229 to 12,238). One point of WACC at 2% growth removes 1,878 (10,229 to 8,351). A reader who is comfortable arguing about the discount rate and not about terminal growth is arguing about the smaller half.
The top of the range is reachable by assumption. The residual income model reports 15,439. The grid reaches 15,804 at 7.5% WACC and 3% growth. That combination is defensible on its own terms and completely different from the base case. The disagreement between the four methods is not mysterious; it is a disagreement about where on this grid the business sits.
Why a static table is worse than no table
The common failure is a sensitivity table that was pasted as values rather than left as formulas. It looks identical, it is monotone, and it stops being true the moment any driver changes, including the ones the table does not show.
The test is the base cell. If changing a driver in the model does not change the middle of the grid, the grid is a screenshot. The second test is the shape: recompute one corner by hand from the definition and confirm it matches.
A live table also answers the reverse question: given a market price, what combination of WACC and growth does it imply? That is the question a buyer actually asks, and it is only available if the grid is built from the model rather than from memory.
None of this is in the workbook, and the limits sheet says so. What is in the workbook is the base case, four methods and 54 checks that establish the base is internally correct; the grid is what a reader adds when they want to know how far from that base the answer can move. The range article covers how the four methods are assembled without weighting, and the comps piece covers the market anchor that would narrow the grid. The base case the grid reproduces is on the valuation page, and the method whose value sits at the grid's top corner is residual income.
Both inputs are kept as named cells in Mica, which lets the grid be rebuilt from the model rather than pasted as values.