
A dividend model values a dividend policy
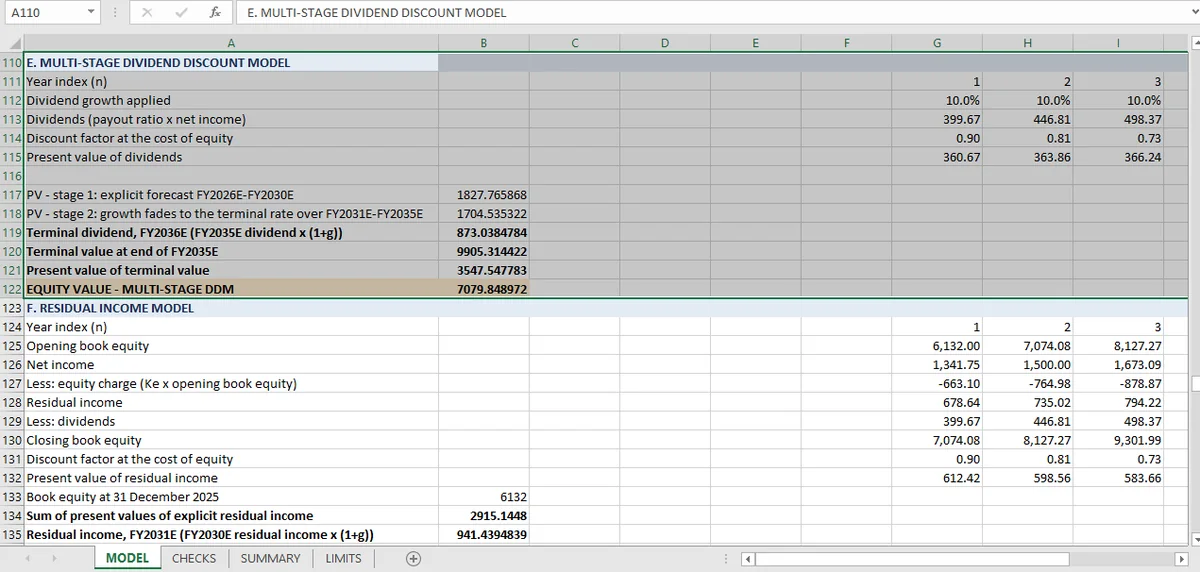
A three-stage dividend model gives 7,080 on a 29.8% payout and 2% terminal growth, implying a 2.85% return on equity forever. That is why it sits at the bottom of the range: it values the payout policy, not the business.
A dividend discount model is the most direct of the four methods and the easiest to misread. It discounts the cash the shareholder actually receives, which is dividends, not the cash the business generates.
Those are different quantities, and the difference is retained earnings. A company that earns 1,175 and pays 350 retains 825, and a DDM assigns no value to that 825 except through the growth it is presumed to fund. If the retention earns nothing, the DDM says the business is worth the present value of its dividends and no more.
In this workbook the DDM produces 7,080 of equity value, the lowest of the four methods. The reason is not an arithmetic error; it is the payout ratio.
The Three Stages of the Dividend Model
The model builds value in three pieces, and a check rebuilds the total from them:
- Stage 1: the explicit forecast, five years of dividends grown at 10% with the payout held at 29.8%.
- Stage 2: a transition period where growth steps down toward the terminal rate.
- Terminal value: a perpetuity at 2% growth, discounted back.
The check that matters is the one that recomputes the present value of stage 1, stage 2 and the terminal value separately and confirms they sum to the reported 7,080. That is continuity of *arithmetic*. Continuity of *assumption* is a different question, and it is where the model is honest about what it is doing.
The terminal assumption sets the answer
Keep the 29.8% payout in the terminal year. Grow dividends at 2% forever. The implied return on equity is then fixed by the sustainable growth relationship:
A business earning 2.85% on equity forever, against a 10.81% cost of equity, is not a business anyone would pay a premium for. The model is not forecasting that; the limits sheet says the terminal stage is "deliberately a conservative boundary, not a forecast of the business."
That is the correct way to read it. The DDM is answering a narrow question: what is the distribution policy worth if it never changes? For a company retaining 70% of earnings, the answer is much less than the business is worth, because the model gives no credit for the retained cash.
Why the stages have to join
A multi-stage model has two continuity requirements, and only one of them is arithmetic.
The dividend in the first terminal year must follow from the last explicit year. If the final forecast dividend is 400 and the terminal formula starts from earnings rather than from that dividend, the value jumps at the join. The check here is structural: the terminal value is computed from the same payout ratio and the same share count, so the series is continuous by construction.
The growth rate must not jump. Dropping from 10% to 2% in a single step is legitimate if the intermediate stage exists to smooth it; dropping without an intermediate stage produces a value that depends on where you draw the line. The workbook has the intermediate stage, and the rebuild check confirms the three pieces are all counted.
What neither check can catch is an inconsistency between the terminal growth and the terminal return. Those two are linked through retention, and a model that sets them independently will produce a number that is arithmetically perfect and economically impossible.
Where the DDM Sits in the Range, and Why
Fourth of four on value: 7,080 against 10,229 for FCFF, 8,370 for FCFE and 15,439 for residual income.
The DDM is the most conservative method here, and it is conservative for a structural reason: it values a 29.8% payout stream at a 10.81% discount rate, while the business retains 70% of its earnings. A model that valued the retained cash would produce something closer to the residual income figure.
That makes the DDM a useful floor rather than a central estimate. If someone asks what the shares are worth to a holder who only ever receives the dividend, the model's answer under the stated payout and terminal assumptions is 7,080; it is not a market price or a recommendation. The fact that it is the lowest of the four says something about the dividend policy, not about the company.
The four methods are assembled in the range article; the method that sits at the top and why is the residual income piece; and the two discounted cash flow routes that bracket the DDM are here. The complete check sheet is in the valuation hub.
With Mica, the stage-by-stage sum is rebuilt in place, which lets the reported value be traced to its three components.