

Capital budgeting: one memo, one project, 67 checks
The case. One investment memorandum went in — a one-page written proposal from the project sponsor. It supplied an initial outlay of 5,000, a five-year life, a salvage value of 500, working capital of 300 invested in year 1 and released in year 5, revenue rising from 3,200 to 4,200, operating costs from 1,900 to 2,400, and a financing mix of 40% debt at 5.5% and 60% equity with a beta of 1.15. Tax is 25%, and the WACC built from those inputs is 7.845%. The memo supplied no outputs: every metric, the two IRR routes and the 17-point NPV profile were computed from it. This is a synthetic case for method demonstration, not investment, tax or legal advice.
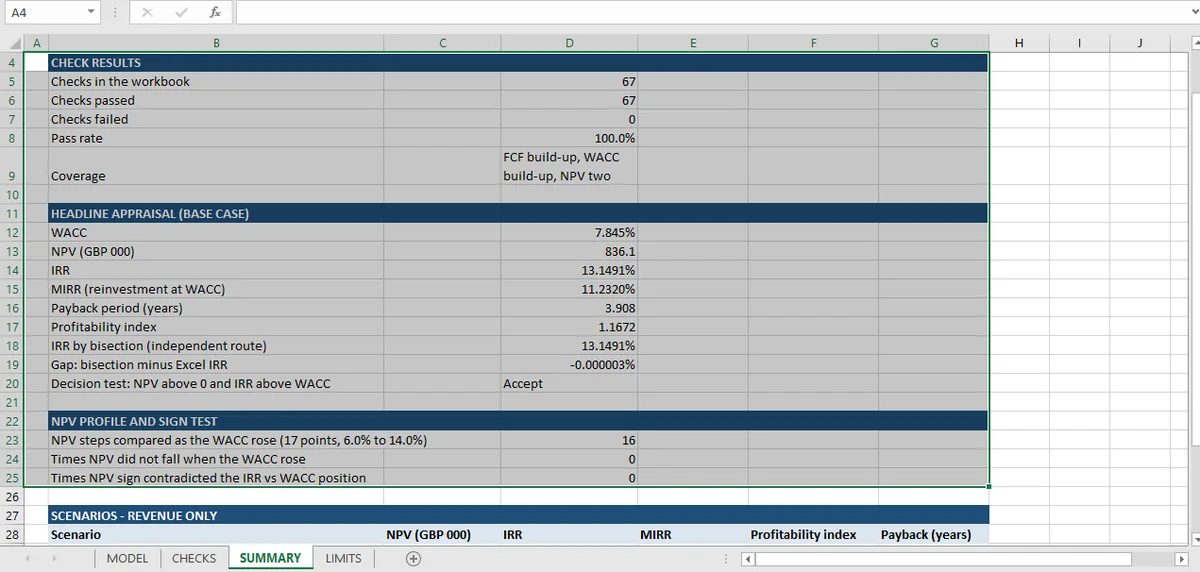
A capital appraisal from one memo was checked by 67 checks: NPV by sum and by function, IRR by Excel and by bisection, MIRR rebuilt by hand, a 17-point WACC profile, and three revenue scenarios. All 67 pass; the downside still gives an NPV of −277.
The 67 checks are a closed loop: the memo's numbers go in, and the arithmetic that follows comes out. The memo is the premise, not one of the conclusions.
What came back is one workbook with four sheets. MODEL holds the assumptions, the free cash flow build, the WACC build, six investment metrics, a twenty-iteration bisection, a seventeen-point NPV profile and three revenue scenarios. CHECKS holds the 67 assertions. SUMMARY counts them. LIMITS lists nineteen things the appraisal does not cover.
| Measure | Result |
|---|---|
| Project | Synthetic project, five years, thousands |
| Checks | 67 |
| Passed | 67 |
| NPV at 7.845% | 836 |
| IRR | 13.15% |
| MIRR at the WACC | 11.23% |
| Payback | 3.9 years |
| Profitability index | 1.167 |
On the memo's inputs, the model returns an accept on every metric — the project clears its cost of capital and creates value in the model — and each metric gets there by a different route. That is the point of the topic: when three metrics disagree, the disagreement is information about the cash flows, not about the arithmetic.
What sixty-seven checks show
The 67 checks fall into seven groups, and each group tests a different kind of claim.
| Group | Checks | What it establishes |
|---|---|---|
| Setup: WACC and weights | 5 | Weights sum to one, WACC is built from its parts, tax rate is consistent |
| Depreciation and tax | 6 | Depreciation sums to investment less salvage, tax equals EBIT × 25% |
| Free cash flow build | 8 | Each year's FCF equals its components; year 0 is the outlay |
| NPV and IRR, two routes each | 6 | NPV by sum and by Excel's function; IRR by Excel and by bisection |
| Payback, PI and MIRR | 5 | Each metric recomputed from its own definition |
| NPV profile | 20 | 17 WACC points, monotonicity, and sign agreement with IRR |
| Scenarios | 17 | Only revenue moved; everything else identical across scenarios |
Three of those groups carry weight beyond their count.
The IRR is solved twice, by different methods. Excel's IRR() uses an iterative guess-and-refine routine. The model also finds the root by bisection from a fixed bracket of 6% to 20%, using only the cash-flow row and a sign test. Twenty iterations narrow the bracket to 2.67 × 10⁻⁷, and the two answers differ by 3.4 × 10⁻⁸, about three ten-thousandths of a basis point. That is what a convergence check looks like when the second route is genuinely independent of the first.
The NPV profile is a check on IRR, not a chart. At each of 17 WACC points from 6.0% to 14.0%, the model tests two things: that NPV falls when WACC rises, and that the sign of NPV agrees with the sign of (IRR − WACC). Both hold at every point. NPV crosses zero between 13.0% and 13.5%, which is where the IRR sits, and the sign flips with it.
The scenarios move revenue and nothing else. That is a deliberate restriction and it is checked: operating costs, capex, working capital, salvage, depreciation and the discount rate are all asserted to be identical across the three scenarios. It makes the scenario comparison clean, and it also means the model does not test cost risk or financing risk at all.
How it was built
The instruction did not supply a single output. It supplied the memorandum: the outlay, the life, the salvage, the working capital, revenue and operating costs by year, and the financing terms. The model had to build the free cash flow from those, compute every metric, and then compute each metric a second time by a route that does not use the first. The same construction from assumptions is worked through in the DCF walkthrough.
Three of those second routes are what distinguish this workbook from a calculator. NPV is recomputed with Excel's own function; the IRR is re-solved by bisection from a fixed bracket; MIRR is rebuilt by hand rather than taken from the built-in function. Each is a different algorithm sharing only the cash-flow row, which is the definition of a convergence check.
The workbook mechanics that make those routes possible — named inputs, a separate calculation block, no typed outputs — are the ones described in the Excel-for-finance guide.
The scenarios were constrained in the same spirit. The instruction asked for revenue-only flexing, and five checks assert that the other drivers did not move. That is a narrow test by design: it isolates the revenue effect, and it tells you exactly what the scenario table is not measuring.
The three scenarios, and the shape of the answer
| Scenario | Revenue total, years 1–5 | NPV | IRR | MIRR | PI | Payback |
|---|---|---|---|---|---|---|
| Base | 18,700 | 836 | 13.15% | 11.23% | 1.167 | 3.91 |
| Upside (+10% revenue) | 20,570 | 1,949 | 19.86% | 15.18% | 1.390 | 3.32 |
| Downside (−10% revenue) | 16,830 | −277 | 6.03% | 6.62% | 0.945 | 4.46 |
The asymmetry is the finding. A 10% revenue move takes NPV from +836 to −277 on the downside and +1,949 on the upside: symmetric in money, wildly asymmetric in decision terms, because one side crosses zero and the other does not. The project's margin of safety is about 7.5% of revenue, not the 15% that a ±10% range suggests at a glance.
The downside case is also where the metrics start to disagree, and they disagree in an instructive order: NPV goes negative and PI falls below 1 together, because PI is 1 + NPV divided by the present value of outflows and the two cannot diverge. IRR drops to 6.03%, below the 7.845% WACC. Payback stretches to 4.46 years against a five-year life. In this downside scenario, all four model outputs point to reject, and none of them does so more clearly than NPV.
The six pieces in this series
Do NPV, IRR and MIRR have to agree? takes the three metrics apart and shows why a 1.92-point gap is the reinvestment assumption rather than an error. How much does the WACC have to move walks the seventeen-point profile to the exact rate at which the decision flips. What financing structure moves changes the debt share and finds that only one of the two effects that should move does. Payback and the profitability index shows a case where payback stays inside the project life while NPV goes negative. Three scenarios are not a distribution covers what a simulation would add and what it would cost. One project, six metrics, sixty-seven checks is the construction view, and the ten-minute verification route.
What the appraisal leaves out
Six limits matter more than the rest, and the workbook states all nineteen.
The inputs are the memo's. Revenue, costs, salvage, working capital and the financing assumptions are taken as given. The checks prove the arithmetic that follows from them, not that the memo is right. A model can pass 67 checks and still appraise a project that does not exist. The same discipline on a full set of statements is in the three-statement checks.
There is no probability anywhere. Three scenarios are three stories, not a distribution. Nothing in the workbook weights them, and no Monte Carlo was run. The article on what a project-level simulation would add covers what that would change and what it would cost.
Only revenue flexes. Cost risk, financing risk and timing risk are untested by construction. A project whose costs overrun is invisible to a revenue-only scenario set.
Beta is used as given. There is no relevering from comparables and no debt beta, and the 40/60 structure is assumed constant for five years. The article on financing structure shows what that assumption does to the WACC when the weights move.
Timing is annual. Every cash flow is a year-end amount. A project with a January outlay and a December return is modeled identically to one with the reverse, and the working capital outflow sits entirely in year 1.
The checks are internal. Sixty-seven passes show that the model is consistent with itself and with its own definitions. They do not show that the convention is right. MIRR at the WACC is a convention, simple payback is a convention, and a single IRR assumes a single sign change.
The useful reading of this workbook is the one the base case invites: an 836 NPV on a 5,000 investment, a profitability index of 1.167 and a 3.9-year payback. On the memo's assumptions, the base case returns a positive NPV and a project that clears its cost of capital, with a thin margin against a 10% revenue miss; whether that makes it a good project is a judgment the model does not make. Every number in that sentence is in the file, and so is the one that qualifies it: the downside NPV is negative.
The appraisal was built inside Excel through Mica, which puts all 67 checks in the same file as the cash flows they test.
Frequently asked questions
Why do NPV and IRR give different answers?
The gap is the reinvestment assumption. NPV discounts at the cost of capital, while IRR assumes every interim cash flow is reinvested at the IRR itself. Here IRR is 13.15% and MIRR at the 7.845% WACC is 11.23%, a 1.92-point gap that is the assumption rather than an arithmetic error.
Should you use NPV or IRR to accept a project?
In corporate finance, NPV is the conventional primary rule for a conventional project because it measures value in money and does not assume reinvestment at the project's own rate; the model reports NPV, IRR and MIRR, and choosing among them is a methodological convention, not a recommendation about any real project. IRR is useful as a rate of return and for comparing projects of similar scale, but it can mislead when cash flows change sign more than once or when project sizes differ. This project has a single sign change, so its 13.15% IRR is unambiguous.
Why compute the IRR twice?
Excel's IRR() iterates from a guess; the bisection block solves the same root from a fixed 6%–20% bracket and lands 3.4 × 10⁻⁸ away.
What discount rate should a project appraisal use?
As a methodological starting point, the weighted average cost of capital, built from the financing weights and the after-tax cost of debt. Here 40% debt at 5.5% and 60% equity with a beta of 1.15 give a WACC of 7.845%; NPV crosses zero between 13.0% and 13.5%.