

Two shortcut metrics, checked properly
Payback of 3.91 years and a profitability index of 1.167 both point to accept. In the downside scenario payback is still 4.46 years inside a five-year life while NPV is −277. That is why neither metric decides.
Payback and the profitability index are the two metrics most often computed loosely. Payback is usually eyeballed off a cumulative column; the profitability index is usually NPV divided by something, with the something forgotten.
Both can be computed exactly, and when they are, they become useful checks rather than shortcuts. Payback measures liquidity and timing; the profitability index measures value per unit of outlay. Neither measures value created, and the point of computing them precisely is to see exactly where they stop agreeing with the metric that does.
Payback, from the cumulative row
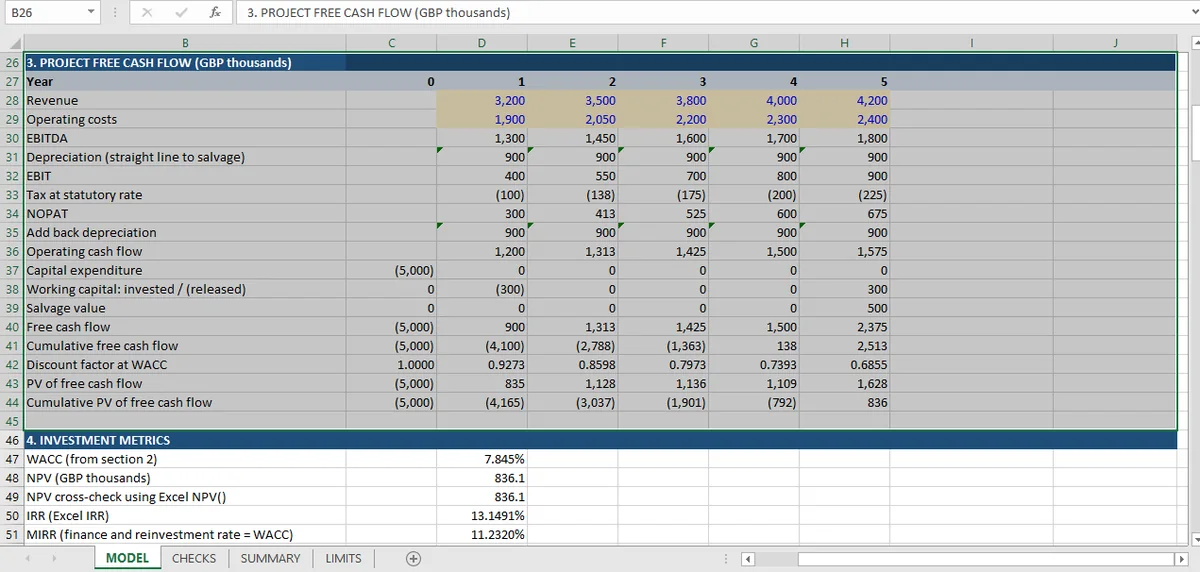
The free cash flow is −5,000 at year 0, then 900, 1,312.5, 1,425, 1,500 and 2,375. The cumulative row crosses zero in year 4:
| Year | 0 | 1 | 2 | 3 | 4 | 5 |
|---|---|---|---|---|---|---|
| Free cash flow | −5,000 | 900 | 1,312.5 | 1,425 | 1,500 | 2,375 |
| Cumulative | −5,000 | −4,100 | −2,787.5 | −1,362.5 | 137.5 | 2,512.5 |
Payback is not simply "year 4". It is 3 plus the fraction of year 4 needed to clear the remaining 1,362.5 out of that year's 1,500, which is 3.9083 years.
The workbook mechanics — one formula over the cash-flow row, no eyeballed cumulative — are the ones described in the Excel-for-finance guide.
Two checks make that exact rather than approximate: the cumulative balance at the payback year is non-negative (137.5), and the balance in the year before is still negative (−1,362.5). Those two assertions define the crossing point and catch the case where a model reports a payback year that the cash flows never actually reach.
Simple payback is undiscounted, and the limits sheet says so. Discounting the cumulative row instead would push the crossing into year 5, and a model that mixes the two produces a number that is neither.
Where Payback Contradicts NPV
Payback can stay inside the project life while NPV is negative.
The downside scenario is the demonstration. Revenue 10% lower gives:
- Payback of 4.46 years, still inside the five-year project life.
- NPV of −277, which means the project destroys value.
- IRR of 6.03%, below the 7.845% cost of capital.
Payback says the money comes back before the project ends. NPV says the money that comes back is worth less than the money that went out. Both are true, and they are consistent once you see what payback measures: it counts nominal cash, ignores everything after the crossing, and applies no discount.
That is the boundary. A payback inside the project life is a necessary condition for a project to be worth doing, and it is nowhere near sufficient. A firm that screens on payback alone would approve this project in the downside case.
The profitability index, and its identity
The index is the present value of inflows divided by the present value of outflows: 5,836.05 over 5,000, which is 1.1672.
Its identity, that the index equals one plus NPV divided by the present value of outflows, is checked directly, and it holds to twelve decimal places. That identity is also why the index and NPV can never disagree about a single project: NPV above zero and index above one are the same statement. The model checks that too, and finds agreement.
So the index adds nothing to the decision for one project. What it adds is comparability: 0.167 of value per unit of outlay is a number that can be put next to another project's number, which NPV cannot do directly when the outlays differ.
Discounted payback, for completeness
Discounting the same cumulative row at 7.845% pushes the crossing from year 4 into the fifth year: the cumulative present value is −791.98 at year 4 and +836.05 at year 5, so the discounted payback is 4.49 years rather than 3.91.
Both numbers are correct, and they answer different questions. The undiscounted version says the firm gets its money back in under four years in cash terms. The discounted version says it takes four and a half years to recover the outlay in present-value terms, which is the version that belongs next to an NPV.
What goes wrong in practice is mixing them: reporting an undiscounted crossing next to a discounted cumulative column, or computing the fraction against the wrong denominator. The check that catches the second error is the pair this workbook uses: the balance at the payback year must be non-negative and the balance the year before must be negative. It pins the crossing to a period and a fraction, and it fails immediately if someone recomputes the fraction against a different year's cash flow.
Microsoft's NPV function documentation is worth reading alongside this, because the built-in function discounts the first value by one period. A model that puts the initial outlay inside the NPV() range gets a payback and an NPV that are both wrong by exactly one period of discounting. Both still look plausible.
The scale trap the index does not solve
The index cannot rank projects either, and the reason is worth stating because it is often presented as its advantage.
Consider a project requiring 100 of investment with an index of 1.5 and one requiring 10,000 with an index of 1.2. The first creates 50 of value; the second creates 2,000. Ranking by index prefers the first; ranking by NPV prefers the second. Both rankings are defensible and they answer different questions: efficiency of capital versus total value. The model reports both rankings. Which one a firm weights more is a capital-allocation policy choice; it is not a model output or a recommendation.
This workbook contains one project, so it cannot demonstrate that conflict, and the limits sheet does not claim otherwise. What it can demonstrate is the boundary in the other direction: in the downside case the index falls to 0.945, below one, at the same time as NPV goes negative. The two move together by construction, which is the point.
What Payback and the Profitability Index Are For
Payback measures liquidity and timing; the profitability index measures value per unit of outlay.
Neither is a decision rule. Both are checks on the shape of the cash flows, and each answers a question NPV does not.
Payback answers: how long is the capital exposed? A 3.9-year payback on a five-year project means the firm carries the risk for most of the project's life before recovering its outlay, which is a liquidity fact that a discounted sum hides.
The index answers: how much value per unit of scarce capital? A 1.167 index on a 5,000 outlay is a number that can be compared with other uses of 5,000, and that comparison is the one a capital-constrained firm actually faces.
Both are computed here from their own definitions rather than from a shortcut, and both are checked against the cash flows that produce them. All 67 checks are collected in the capital budgeting hub. For the metric that does decide, the NPV, IRR and MIRR comparison is the companion piece, and for the scenario that produced the downside case, the integration article explains how the three scenarios are constrained.
The same "what does this metric actually measure" question is asked on the fixed-income side, where three duration methods are checked against each other: Macaulay, modified and effective.
Each metric is written as a formula over the cash-flow row in Mica, so payback and the index trace back to the flows that produce them.