

What the Deterministic Appraisal Does Instead of a Simulation
Three scenarios bracket the answer but say nothing about likelihood. A simulation would give the probability of a negative NPV and show which two inputs drive most of the variance. This workbook has none of that, and says so.
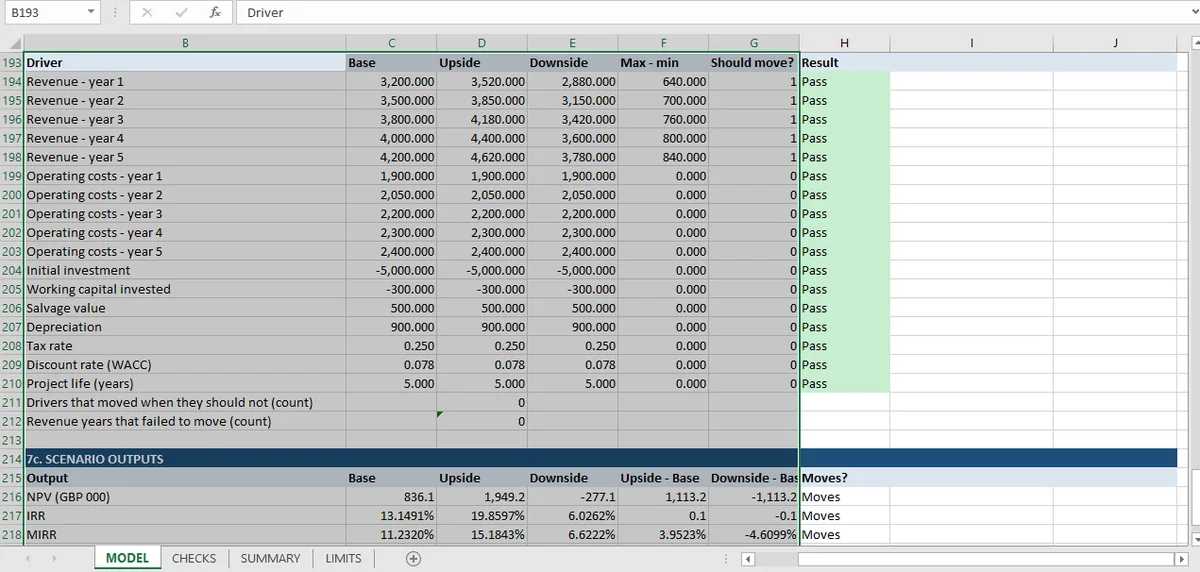
The capital budgeting workbook behind this topic runs three scenarios: base, revenue 10% higher and revenue 10% lower. Their NPVs are 836, 1,949 and −277.
That is a range, not a distribution. Nothing in the workbook says how likely the downside is, whether revenue is more likely to fall by 3% than by 10%, or what happens if revenue falls by 12%. The three cases are three stories, each internally consistent, and the model checks that only revenue moves between them. Operating costs, capex, working capital, salvage, depreciation and the discount rate are asserted identical.
The limits sheet says the same thing directly: single deterministic path per scenario, no probability weights, no Monte Carlo, no distribution of outcomes. This article is about what that omission costs and when it is worth closing.
What a distribution would add
Three things matter most, ranked by how much they change a decision.
A probability of loss. The downside NPV is negative. Whether that matters depends entirely on how likely the downside is, and the workbook cannot say. If revenue is symmetrically distributed around the base, a 10% shortfall is one tail of a symmetric distribution and the probability of a negative NPV is a number that can be computed. If revenue is bounded below by contracted volume and unbounded above, the distribution is skewed and the answer is different again.
The shape between the cases. NPV is not linear in every input, and the three scenarios sit at the same distance from the base in revenue terms. A simulation samples the whole range: the region between −3% and −7%, where the answer may still be positive but the margin is thin, is where the decision actually lives.
Which input is doing the work. With a single scenario you know revenue moved. With a distribution you learn that 80% of the variance in NPV comes from two inputs, and that the rest could be fixed at their base values without changing the answer. That is the output that makes a simulation worth running: not the probability, the attribution.
The three inputs worth simulating
Most of the nineteen limits in this appraisal are boundaries a simulation would not help with: annual timing, no inflation, no tax losses. Three are genuinely uncertain and worth a distribution.
Revenue. The obvious candidate, and the one the scenarios already flex. Its uncertainty is not symmetric: a project can underperform its memo by 30% and there is no structural floor, while outperformance is capped by capacity.
Operating costs. Held constant across the three scenarios, which means cost risk is completely untested. Costs are typically less volatile than revenue and highly correlated with it, because a volume shortfall reduces variable cost too. That correlation is the thing a naive simulation gets wrong.
The discount rate. Treated as a fixed 7.845% in every scenario. It is the input with the largest single-point effect on NPV: a one-point rise costs about 80 of NPV at this project's scale, and the break-even is 13.15%.
Simulating revenue and cost independently would be worse than not simulating at all, because the correlation between them is most of what determines the downside. That is a judgement, not a calculation, and it belongs in a cell where a reader can see it.
What a Monte Carlo Costs and How to Check the Result
A Monte Carlo is cheap to run and expensive to trust. Three things have to be true before the output means anything.
The generator has to be reproducible. Excel's RAND() cannot be seeded, so a model built on it produces a different answer every recalculation and cannot be checked. A seeded generator (a cell holding the seed, feeding a simple linear congruential routine, or Excel's RANDARRAY with a stored state) turns the simulation into a fixed input like any other.
The percentiles have to converge. Run the same model with two different seeds and compare the 5th, 50th and 95th percentiles. If they move by more than the precision you need, add paths. This is a convergence check in the same sense as the two IRR routes: two independent runs, one conclusion.
There has to be something to check against. Where the model is linear in the simulated inputs, the analytic standard deviation of NPV can be computed directly and compared with the simulated one. Where it is not, the check is the seed comparison, which catches implementation errors but not specification errors.
The quantitative-methods workbook in this series is the working example: ten thousand paths, a 20250101 seed stored in a cell, and a convergence check against a closed-form answer. It is one of the 31 checks in that model, and the convergence article walks through the closed-form comparison; it is the pattern to copy for a project-level run.
A minimal simulation you can build this afternoon
The full version needs a seeded generator, ten thousand paths and a convergence check. A working version needs four columns and an hour.
Draw the inputs. A triangular distribution is usually the honest choice for a memo estimate: a low, a most likely and a high, which is exactly how the assumptions were elicited. RAND() plus the inverse-CDF formula gives you the draw, and RANDARRAY generates a whole column of uniform draws in one call.
Apply a correlation. Revenue and cost move together. A single random factor per path, shared between the two draws and blended with an independent one, is enough to stop the simulation from producing impossible combinations.
Compute NPV per path. One column, one formula, referencing the draw in the same row.
Summarize, then check. Report the 5th, 50th and 95th percentiles and the share of paths with negative NPV. Then change the seed and repeat. If the three percentiles move more than your precision, you do not have enough paths, and the seed comparison is the only check that will tell you.
The thing that makes this trustworthy is not the number of paths. It is that the seed is a cell, so the run is reproducible, and that the summary is recomputed from the paths rather than typed.
When Not to Run a Monte Carlo
A simulation produces a precision that the inputs do not support. If revenue is a memo estimate with a plausible range of ±15%, the difference between the 40th and 45th percentile of NPV is not information.
The test is whether the output changes a decision. If the base case is accepted with a wide margin, a distribution confirms it and changes nothing. If the base case is marginal (NPV of 836 on 5,000, a downside of −277, a break-even WACC 5.3 points above the base), then the probability of a negative NPV is exactly the number a decision-maker needs, and three scenarios do not supply it.
That is the honest position for this workbook: the deterministic appraisal is complete and checked, and the question it leaves open is the one a simulation would answer. The capital budgeting hub holds all 67 checks, including the scenario-isolation checks that make the three cases comparable; the integration article covers how the model is built to make either route possible.
Because Mica recalculates the whole workbook in place, a seeded simulation stays re-runnable against the same file.