

WACC Is a Build, Not a Number
The WACC is built from six inputs and three formulas, not typed as a number.
A 7.845% WACC gives an NPV of 836 on this project. Walk the rate from 6% to 14% and the decision flips at 13.15%. That is 5.3 points of headroom, or 68% more cost of capital before the project stops paying.
The WACC in this appraisal is 7.845%. That figure is not an input; it is the output of six inputs and three formulas, and every one of them can be wrong.
| Input | Value | Where it comes from |
|---|---|---|
| Risk-free rate | 4.00% | Financing assumption in the memo |
| Equity beta | 1.15 | Given, not relevered |
| Market risk premium | 5.50% | Financing assumption |
| Pre-tax cost of debt | 5.50% | Financing assumption |
| Target debt share | 40% | Financing assumption |
| Tax rate | 25% | Project tax rate |
From those: the cost of equity is 4.00% + 1.15 × 5.50% = 10.325%. The after-tax cost of debt is 5.50% × (1 − 0.25) = 4.125%. The WACC is 0.60 × 10.325% + 0.40 × 4.125% = 7.845%.
Five checks confirm the build rather than the number: that the weights sum to one, that the cost of equity equals Rf plus beta times the premium, that the after-tax cost of debt equals Kd times one minus tax, that the WACC equals Ke less the debt share times the spread between Ke and the after-tax Kd, and that the tax rate in the after-tax cost of debt matches the project tax rate. Those are identities. Passing them proves the arithmetic, not the inputs.
What each input costs
The sensitivity is not uniform across the four. A one-point change in each, holding the others:
- Beta, 1.15 to 1.25, adds 0.55 points to the cost of equity, which is 0.33 on the WACC at a 60% equity share.
- Market risk premium, 5.5% to 6.5%, adds 1.15 points to Ke, which is 0.69 on the WACC.
- Risk-free rate, 4% to 5%, adds a full point to Ke and 0.6 to the WACC.
- Cost of debt, 5.5% to 6.5%, adds 0.75 to the after-tax cost and 0.3 to the WACC at a 40% debt share.
The risk-free rate and the market risk premium are the two that matter, and they are the two that are least specific to the project. That is the first useful observation from a sensitivity: the discount rate's biggest levers are macro inputs, not project inputs.
Walking the profile from 6% to 14%
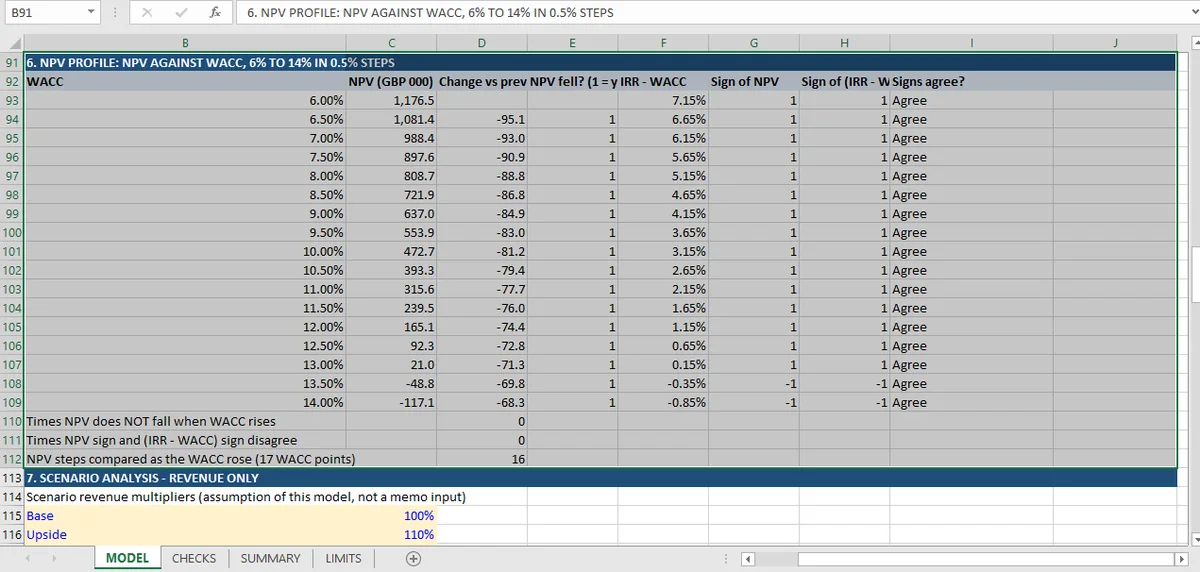
The workbook builds a 17-point NPV profile in 0.5% steps and checks every step. Each point is a full re-discount via Excel's NPV function, which treats every value as arriving at the end of a period. That is the convention the cash-flow row is built on. The endpoints:
| WACC | NPV | Change from previous step |
|---|---|---|
| 6.0% | 1,176.51 | — |
| 8.0% | 808.73 | −88.82 |
| 10.0% | 472.72 | −81.22 |
| 12.0% | 165.09 | −74.42 |
| 13.0% | 20.97 | −71.29 |
| 13.5% | −48.82 | −69.79 |
| 14.0% | −117.14 | −68.33 |
Two things are visible in that table before any check runs. The first is the break-even point: NPV is still positive at 13.0% and negative at 13.5%, so the decision flips somewhere in a half-point window around 13.15%. That is the IRR, and it is where it has to be. The second is that the profile flattens as the rate rises: each step costs less than the one before, because discounting dominates the earlier, smaller cash flows first.
If you want the same discounting built from scratch, the DCF walkthrough starts with the cash-flow row and adds the rate afterwards.
The sign test that makes the profile a check
A profile is a chart until something is asserted about it. Two assertions are made at every point.
Monotonicity. NPV falls when the WACC rises. Across 16 steps, it fails zero times. This is not a trivial result to assert: it holds here because every cash flow after year 0 is positive, and the limits sheet says so explicitly. A project with a large mid-life outflow can produce a non-monotonic profile, and a model that assumes monotonicity would silently mis-report it.
Sign agreement with IRR. At every WACC point, the sign of NPV must agree with the sign of (IRR − WACC). It does, at all 17 points: positive NPV and positive spread from 6.0% through 13.0%, negative and negative at 13.5% and 14.0%. Zero disagreements.
The second check is the one worth copying: a cross-check between two different computations, a discounted sum and a solved root, and it fails the moment either one is wrong. A model can have a perfectly monotone profile and still have the wrong IRR; it cannot have sign agreement at every point while one of the two is broken.
Where the NPV Flips as WACC Moves
The project is accepted at a 7.845% WACC with 836 of NPV, and rejected at anything above 13.15%.
The gap between those two numbers is the margin of safety in discount-rate terms: 5.30 percentage points, or a 68% increase in the cost of capital. That sounds generous until it is compared with the sensitivity of the inputs. A one-point move in the risk-free rate plus a one-point move in the market risk premium is 1.29 points on the WACC; a beta re-estimated at 1.6 rather than 1.15 adds another 1.49. All three together take the WACC to 10.6%, which is still 2.5 points short of the break-even. That, rather than the 68%, is the real margin.
The honest summary is that this project clears a comfortably-built discount rate and does not clear a pessimistic one, and the pessimistic build is not far-fetched. That is a different sentence from "the project has a positive NPV", and it is the sentence the profile supports.
What the NPV Profile Does Not Tell You
A 17-point profile is a single-driver sensitivity, and three things sit outside it.
It assumes the WACC is the only thing moving. Revenue, costs and the outlay are held at memo values while the rate walks from 6% to 14%. A tornado chart (every driver moved by the same plausible amount, ranked by effect) would show whether the discount rate is even the biggest lever. For this project it probably is not: a 10% revenue miss moves NPV by 1,113, while a full point on the WACC moves it by about 80.
It assumes monotonicity, and the model says why. The check that NPV falls as the rate rises holds because every cash flow after year 0 is positive. A project with a large mid-life outflow, such as a decommissioning cost or a reclamation obligation, can produce a profile that rises before it falls. A model that asserts monotonicity would fail on it instead of ignoring it.
It says nothing about how likely a higher WACC is. The break-even is 13.15%; whether that is near or far depends on the volatility of the inputs, not on the arithmetic of the profile.
None of it says the inputs are right. Beta is used as given, with no relevering from comparables and no debt beta, and the 40/60 structure is assumed constant for five years. The financing-structure article takes that assumption apart; the integration article shows how the profile checks fit into the rest; the capital budgeting hub carries all 67 checks, including the twenty behind this profile.
The discount rate lives in a named cell in Mica, which is what lets the whole profile be re-run without touching a formula.