

An appraisal is a chain of five sections
Sixty-seven checks across five sections: assumptions, free cash flow, metrics, independent routes and scenarios. Each metric is computed twice, each scenario is isolated, and the accept-or-reject line is itself an assertion.
The workbook behind this topic builds a project appraisal from a one-page memo, and it does it in five sections, each of which feeds the next.
Assumptions: the investment, life, salvage, working capital and tax rate, plus the six financing inputs that build the WACC. The free cash flow: revenue less operating costs, less tax on EBIT, plus depreciation, less capex, plus or minus working capital, plus salvage. The metrics: NPV, IRR, MIRR, payback and the profitability index. The independent routes: a bisection that re-solves the IRR and a seventeen-point NPV profile. The scenarios: the same model three times, with only revenue changed.
Sixty-seven checks sit across those five sections. The 67 checks are not independent opinions: they are assertions that each section is what it claims to be, plus cross-checks that the sections agree.
What the 67 checks are for
| Group | Checks | What it establishes |
|---|---|---|
| Setup | 5 | Weights sum to one; WACC, Ke and after-tax Kd are built from parts; tax rates agree |
| Depreciation and tax | 6 | Depreciation sums to investment less salvage; tax equals EBIT × 25% each year |
| Free cash flow | 8 | Each year's FCF equals its components; year 0 is the outlay; WC and salvage land in year 5 |
| NPV and IRR, two routes | 6 | NPV by sum and by NPV(); NPV at IRR is zero; bisection converges to IRR() |
| Payback, PI, MIRR | 5 | Each metric rebuilt from its own definition |
| NPV profile | 20 | 17 WACC points, monotonicity, sign agreement with IRR |
| Scenarios | 17 | Only revenue moved; base equals the model; ordering holds |
Three of those groups are worth reading closely.
The NPV is computed three ways. Once as the sum of discounted cash flows, once with Excel's NPV() function, and once at the solved IRR, where the answer must be zero. All three agree: the first two to 2 × 10⁻¹³, the third to 8.08 × 10⁻⁸. That is what a metric looks like when it is defined rather than copied.
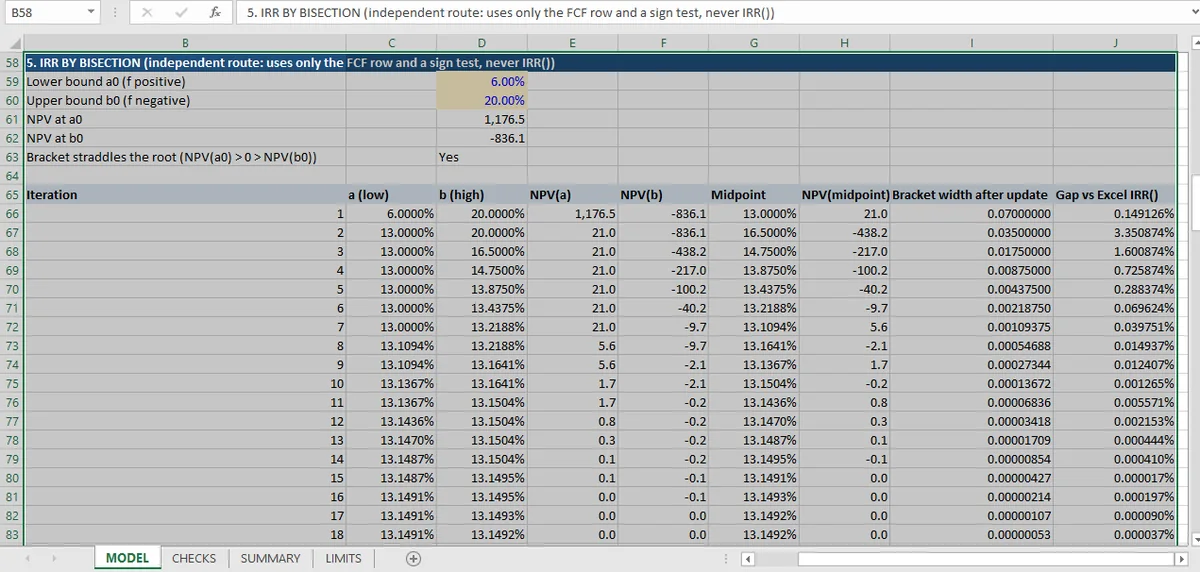
The IRR is solved by a second algorithm. Excel's IRR() iterates from a guess and gives up with #NUM! after 20 attempts, which is documented behavior rather than a failure mode. The bisection block starts from a fixed 6%–20% bracket, confirms the bracket straddles the root, and halves it twenty times. The bracket narrows to 2.67 × 10⁻⁷ and the answer lands 3.4 × 10⁻⁸ from Excel's: three ten-thousandths of a basis point apart.
The scenarios are checked for isolation. Five of the seventeen assert that operating costs, capex, working capital, salvage and depreciation did *not* move between scenarios, and three assert that revenue did. Then the ordering is checked: upside NPV above base above downside. A scenario table where the downside quietly also changed the discount rate would look plausible and mean nothing; the isolation checks are what stop that.
The decision rule is an assertion, not a sentence
The summary sheet ends with a line that reads *Decision test: NPV above 0 and IRR above WACC — Accept (model output)*.
The line is not typed; it is computed, and both halves of it are checked separately: that NPV is above zero, and that the profitability index is above one, which is the same statement in different units. The profitability-index control is 1 + NPV / PV outflows by construction. It proves the identity, not the cash flows. The model does not decide that the project should be accepted; it decides that the two conditions agree, and reports the threshold they cross.
Why bother? Because a memo can say "NPV positive, IRR above the hurdle" without either being true, and a reader who trusts the sentence has no way to check it. A decision expressed as an assertion can be re-run.
What the Appraisal Model Does Not Do
Nineteen limits, and the four that matter most for a reader deciding whether to rely on it.
The inputs are the memo's. Revenue of 3,200 rising to 4,200, operating costs of 1,900 rising to 2,400, a 5,000 outlay, a 500 salvage and a 300 working capital round trip. Every one is taken as given. The checks prove what follows from them; they cannot prove the memo is right.
The memo is a one-page document, and its numbers were typed, some after more than one OCR pass. The 67 checks test the arithmetic that follows from the memo, not the transcription; the memo is the premise.
The same boundary applies to the statements that feed the memo; the three-statement integration is the other end of the chain.
There is no probability. Three scenarios, no weights, no simulation. The downside NPV is −277 and the workbook cannot say how likely that is. The project Monte Carlo article covers what closing that gap would require.
Financing is a target-weight WACC with a fixed beta. No relevering, no debt beta, structure constant for five years. The financing structure article shows what that does to a leverage sensitivity: the WACC moves with the weights because nothing else moves with them.
Timing is annual. All cash flows are year-end. The working capital investment is a single end-of-year-1 outflow and its release is a single end-of-year-5 inflow, with nothing in between.
None of those is a defect to be fixed. They are the boundary of what the appraisal answers, and the useful thing about the limits sheet is that it lets a reader decide whether the boundary matters for their question before they read the numbers.
The One Number to Keep: NPV 836
Strip the sixty-seven checks away and the appraisal says one thing: 836 of value created on a 5,000 outlay, at a 7.845% cost of capital, with a break-even rate of 13.15%.
Everything else in the workbook exists to make that sentence checkable. The two NPV routes prove the discounting; the bisection proves the root; the profile proves the relationship between the two; the payback and index checks prove the shortcuts are computed from their own definitions rather than approximated; the scenario isolation proves the comparison is like-for-like.
If you want the same construction from scratch, the DCF walkthrough builds the cash-flow row first and adds the checks after.
And the limits sheet exists to say what the sentence does not cover: the memo's inputs, a single path, revenue-only scenarios, a fixed beta, annual timing.
Taken together, that is the shape of a verifiable model: not a model that is right, but one whose claim to be right can be tested by someone else. The difference matters most when the answer is close, and here it is close enough to matter: the downside scenario is already negative.
What a reader can verify in ten minutes
Three checks, in this order, will tell you whether the file is worth your time.
Open the NPV profile and look at the two summary numbers under it: how many times NPV failed to fall when the WACC rose (zero), and how many times the NPV sign disagreed with the IRR position (zero). Those two counts cover sixteen comparisons and would move immediately if the cash flows or the root were wrong.
Open the bisection block and read the last gap. If it is under 0.0001%, two algorithms agree and the IRR is not an artifact of Excel's guess.
Open LIMITS and read the first three entries. If they match the question you are asking, the model is answering it.
Everything else (the 67 rows, the scenario isolation, the payback boundary) is there for the reviewer who wants to go further. The NPV, IRR and MIRR comparison is where the three metrics are pulled apart, and the capital budgeting hub has the complete set of results.
The workbook went together sheet by sheet in Excel, through Mica, leaving the checks sheet and the model it reads in the same file.