

The Only Monte Carlo Test That Means Anything: The Closed Form
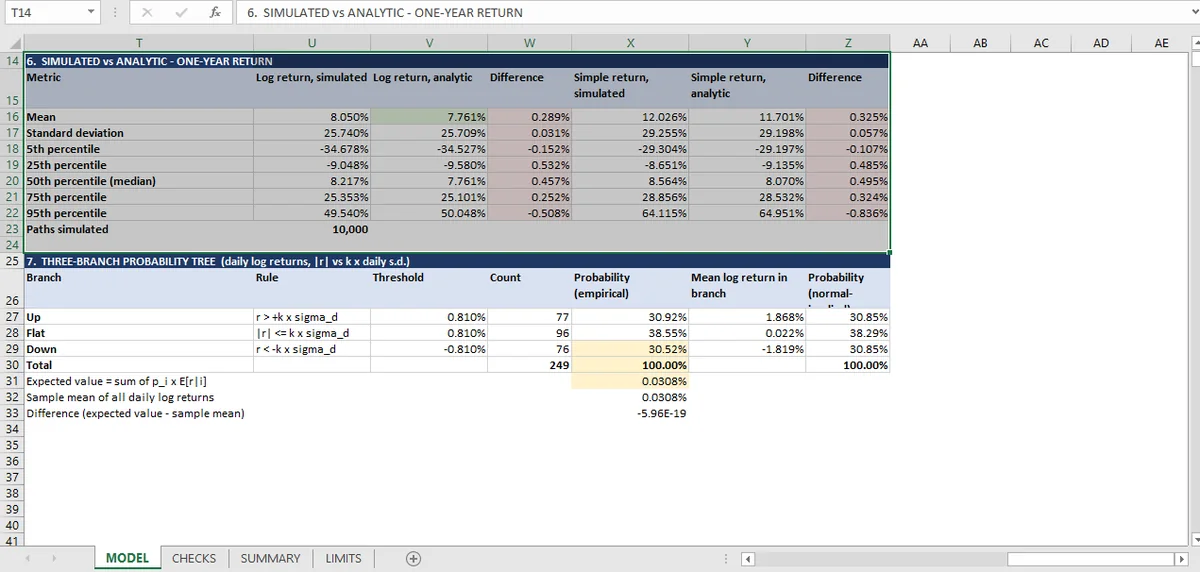
Ten thousand seeded paths reproduce a lognormal distribution: the 5th to 95th percentiles match the closed form within 0.0053, which is sampling error rather than model error. The seed makes the run reproducible; the comparison makes it checkable.
A Monte Carlo produces a distribution. It is useful only if that distribution matches the one the model assumes. The way to answer that is to compute the same distribution analytically and compare.
For a lognormal asset, the answer is closed form. The 5th, 25th, 50th, 75th and 95th percentiles one year ahead follow directly from the drift and the volatility. The simulation has no such formula; it has 10,000 paths and a count.
The Run: 10,000 Seeded Paths
The workbook draws 10,000 paths from the seeded generator, with seed 20250101 stored in a cell. Three checks confirm the run itself:
- The seed is a non-zero integer, so the result is reproducible.
- The number of paths equals the requested count.
- The random draws have mean zero and standard deviation one: 0.0112 and 1.0012, which is what 10,000 normal draws look like.
That third check is the one people skip. A generator with a subtle bias, such as a correlation between successive draws or a truncated tail, will still produce a plausible-looking distribution. The only cheap evidence is the first two moments of the draws.
Comparing Simulated and Analytic Percentiles
The workbook compares five simulated percentiles against the lognormal closed form.
| Percentile | Simulated | Analytic | Gap |
|---|---|---|---|
| 5th | −0.3468 | −0.3453 | 0.0015 |
| 25th | −0.0905 | −0.0958 | 0.0053 |
| 50th | 0.0822 | 0.0776 | 0.0046 |
| 75th | 0.2535 | 0.2510 | 0.0025 |
| 95th | 0.4954 | 0.5005 | 0.0051 |
The widest gap is 0.0053 in log-return terms. That is the Monte Carlo standard error at 10,000 paths, not a modeling error. A percentile estimated from a finite sample has its own sampling distribution, and it does not shrink to zero.
Two more checks cover the moments rather than the percentiles: the simulated mean and standard deviation against the analytic ones. Mean 0.0805 against 0.0776, standard deviation 0.2574 against 0.2571. Again the gap is sampling noise, and again the point is that the model has an independent answer to compare against.
What convergence means here
Convergence in a Monte Carlo is not one number. It is a statement about the standard error, which falls as the square root of the path count: quadrupling the paths halves the error.
Ten thousand paths give a standard error on a percentile of roughly a hundredth of the distribution's spread. That is why the gaps above sit in the third decimal place. If the model needed two decimal places, it would need roughly a hundred times the paths.
The workbook does not test convergence by running different path counts. It checks against the analytic answer, which is stronger: a model that matched at 10,000 paths and diverged at 50,000 would fail a path-count comparison and pass the analytic one.
The seed question
A seeded run is reproducible and not independent. The same seed produces the same paths, which is what makes the check sheet reproducible at all. It also means the simulation is one draw, not the average of many.
The honest use is to treat the seed as part of the model's input, like the volatility: change it and the numbers move by the amount shown above. A check sheet that reruns with two seeds and compares the percentiles is testing the same thing the analytic comparison tests, from the other direction.
What Monte Carlo Convergence Does Not Establish
That the asset is lognormal. The simulation is built on that assumption and then checked against it. The percentile comparison is therefore conditional on the assumption: a fat-tailed asset simulated as lognormal would match the percentiles by construction and say nothing about the tail.
The regression on the same series, the beta article, is the one place the workbook looks at whether the data behaves as assumed, and it finds a 2% R-squared. The tree article covers the two-branch version of the same comparison, and the quantitative hub collects all 31. The series being simulated is in returns and time value, and the portfolio question the simulation does not answer is in the efficient frontier.
Because Mica recalculates the whole simulation in place, changing the seed re-runs every path and every percentile together.