

The first three checks are about the file
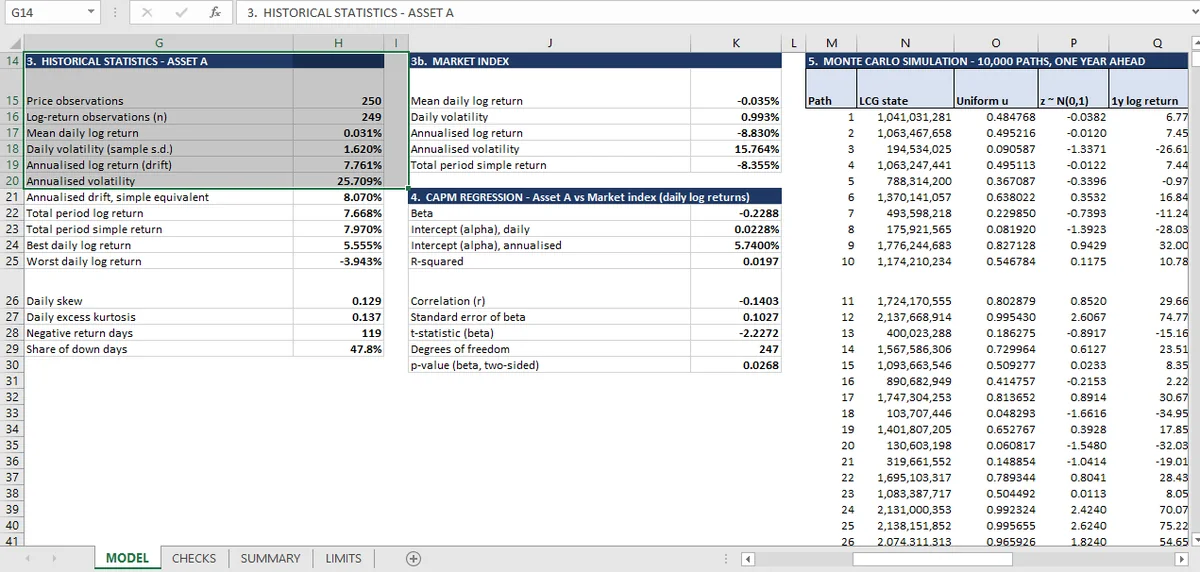
Annualized volatility is the daily standard deviation times the square root of the trading year: 25.71% on 249 returns. Log drift is 7.76%. The analytic lognormal mean is 11.70%, and the simulated mean of simple returns is 12.03%, because a lognormal's mean sits above its log-mean.
Before any statistic is computed, three things have to be true of the price series: the returns count is one less than the prices count, no closing price is zero or negative, and the dates are strictly increasing.
The three checks look trivial; they are the failures that corrupt everything downstream without raising an error, and they are the first step in cleaning a return series.
A missing row changes the returns count, and every count-based statistic with it. A series with 249 prices where there should be 250 produces 248 returns, and the annualized volatility calculated from them is a number that looks fine.
A zero price produces an infinite log return. Excel will show #NUM! in that cell, but if the return is then averaged with a function that ignores errors, such as AGGREGATE(1,6,…), the average is silently computed over the rest of the series. The check that no price is zero or negative is the cheapest defense against a whole class of invisible breakage.
Out-of-order dates produce returns that span the wrong interval: a return from Friday to Wednesday, then Tuesday to Thursday. Nothing errors. Log returns computed on shuffled rows still sum to the total return, which is why the error is so hard to see.
All three checks pass here: 249 returns from 250 prices, zero non-positive closes, zero ordering violations.
The 250 closes were read from a PDF price file, and some prints needed more than one OCR pass. The data checks catch a missing row, a zero price and an out-of-order date; they do not catch a digit read as 8 instead of 6. That error would change every statistic downstream; the data checks are structural, and transcription is outside their scope.
The volatility identity
The first real statistic is the annualized volatility: 25.71%.
The check is an identity rather than a comparison with an external number: annualized volatility must equal the daily standard deviation multiplied by the square root of the trading days in the year. If the model hard-codes a number, or uses 365 instead of the trading calendar, or computes the standard deviation on simple rather than log returns, the identity fails.
That is what makes an identity check useful on a single series. There is no external source to compare 25.71% against, but there is a definition, and the model has to satisfy it.
Drift, and the difference between two means
The annualized log drift is 7.76%. Two means appear in the workbook, and they are not the same number.
The arithmetic mean of log returns is the drift parameter that goes into the simulation. It is 0.0776.
The mean of simple returns is higher: 0.1203 in the simulation, against an analytic lognormal mean of 0.1170. A lognormal's mean exceeds the exponential of its log-mean by half the variance. That relationship is a check in its own right.
Quoting "average return" without saying which mean is one of the most common errors in quantitative writing, and the gap here is 4 percentage points a year on an asset that returns 8%.
Why These Return and Time-Value Checks Are Short
Because the checks are short. Three file-integrity tests and four identities do not need a long defense; they need to be run.
What they establish is that the input to everything else is a clean series and that the three basic statistics are computed from their definitions. What they do not establish is that the series is a good sample. 249 days is one year, one regime, one asset.
The simulation that consumes these numbers is the Monte Carlo article; the regression that uses the same series is the beta piece; and the quantitative hub holds the full 31-check sheet. The two-branch version of the same series is in the probability tree, and the portfolio layer above it is in the efficient frontier.
Series statistics are formulas over the return row in Mica, so a changed price flows through to the annualized number.