
The Out-of-Sample Test the Workbook Does Not Do
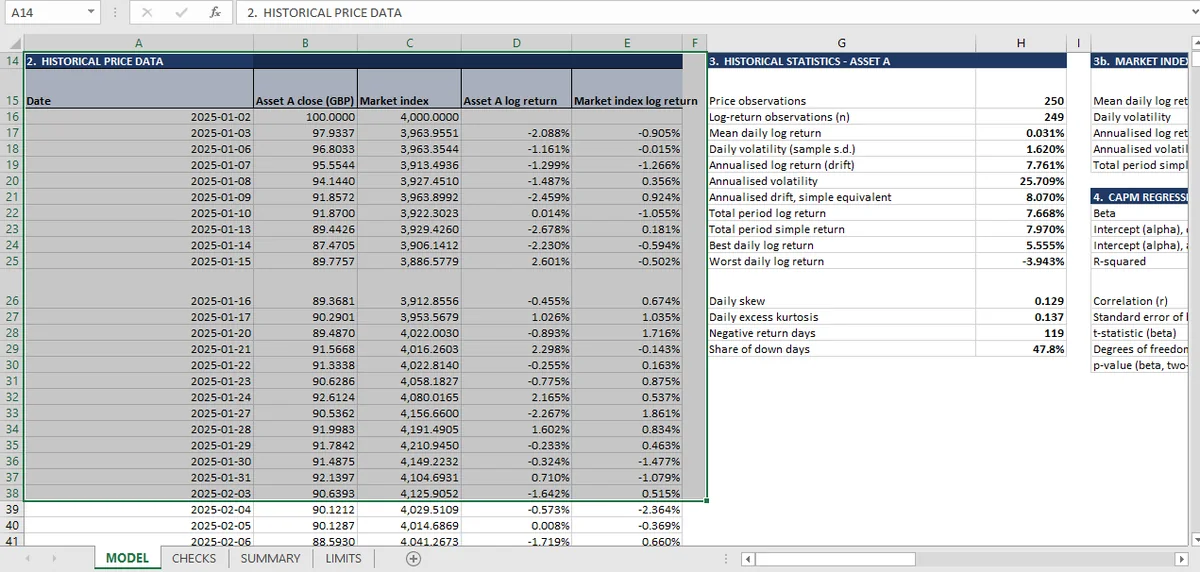
Every statistic in this workbook is computed on the same 249 days, so nothing is out of sample. A split would need more data than the input pack holds; the three ways it leaks are preprocessing on the full sample, overlapping windows, and choosing the split after seeing results.
The quantitative workbook uses 249 daily returns for everything: the volatility, the drift, the regression, the simulation. Every statistic is computed on the full sample, and nothing is held back.
That is a limit, not an error. The workbook's job is to check that the arithmetic is right, and a full-sample estimate is the cleanest way to do it. But a reader who takes the 25.71% volatility and the −0.229 beta as descriptions of the asset has skipped a step, because both numbers describe the 249 days they were fitted to.
What out-of-sample means
Split the series in two. Estimate on the first part, evaluate on the second. The evaluation is out of sample because the second part played no role in fitting.
The result is usually worse than the in-sample fit, and the size of the deterioration is the information. A model that fits 20% of variance in sample and 2% out of sample was fitting noise. One that fits 15% and 12% has found something.
For a single asset with one year of data, a split leaves too little on either side to say anything. That is why the workbook does not do it, and why doing it properly needs more data than the input pack contains.
The three ways a split leaks
Preprocessing on the full sample. If the returns are standardized, winsorized or de-meaned using the whole series and then split, the test set has influenced the model. The mean and standard deviation have to come from the training window alone.
Overlapping windows. A model trained on days 1–150 and tested on days 100–249 overlaps at days 100–150, which are in both. The overlap is not a small leak; it is the model being tested on data it saw.
Choosing the split after seeing results. Trying five splits and reporting the best is in-sample selection wearing an out-of-sample label. The split has to be fixed before the model is fitted.
None of these is exotic. All three are invisible in a final table of statistics, which is why the check has to be structural: the code that produces the test statistic must not be able to see the test rows.
What a check sheet can assert
Four assertions, all mechanical.
- The training window ends before the test window begins.
- Every statistic used to fit the model is computed on the training window only.
- The test set is untouched until the evaluation step.
- Both in-sample and out-of-sample results are reported, adjacent.
The last one is the important one, and it is the one most often skipped. A table that shows only the out-of-sample number hides how much was given up; a table that shows both lets a reader see the deterioration and judge it.
The quantitative workbook does not carry these checks, and its limits sheet does not mention them either. That is the honest gap: the model checks what it computed, and says nothing about whether the sample is long enough, or representative enough, to support a forecast.
Why this matters for the other topics
Every model in this series uses a fixed sample: four years of accounts, one price series, one term sheet. In each case the checks establish internal consistency, and in each case the question "would this hold on different data" is left open.
The division of labour is reasonable for a demonstration, and stops being reasonable when the model is used to predict, and the difference between the two is exactly the split described here.
The Monte Carlo article is the one piece that compares the model against something outside itself, the analytic distribution. That comparison is available only because the distribution was assumed. The regression article shows the same tension in a p-value, and the complete 31-check run starts from the quantitative hub. The statistics a split would divide are in returns and time value, and the analytic comparison that stands in for an outside test is in the Monte Carlo.
The estimation window is left as a stated range in the Mica sheet, which is the first thing a split has to change.