

What the workbook actually is
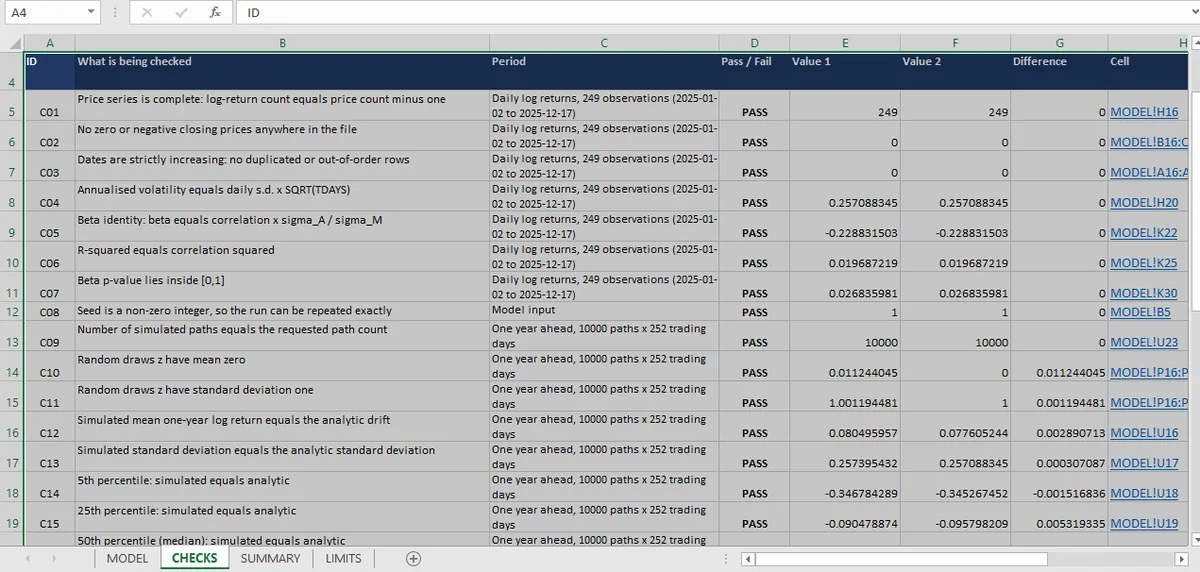
Thirty-one checks on one price series: three for data integrity, four identities, seven for the simulation, four distribution ladders, five for the tree, and the rest on regression reporting. Each group answers a question the next one depends on.
One price series, four questions, thirty-one checks.
The questions are: is the data clean, are the statistics computed from their definitions, does the simulation reproduce the distribution it assumes, and does the regression behave as reported.
| Group | Checks | What it establishes |
|---|---|---|
| Data integrity | 3 | 249 returns from 250 prices, no zero closes, dates in order |
| Identities | 4 | Volatility, beta, R-squared and the p-value follow their definitions |
| Simulation | 7 | Seeded, 10,000 paths, moments match, percentiles match |
| Distributions and ladders | 4 | Ordering holds for simulated and analytic |
| Tree | 5 | Probabilities and counts reconcile to the observations |
| Regression reporting | 2 | Beta identity and correlation squared |
| Percentile and moment comparisons | 6 | Simulated against analytic, simple against lognormal |
The pattern that makes this topic different
In the three-statement model, a check compares one number to another number in the same workbook. Here, six checks compare the simulation to a formula the workbook also computes, and that formula is the model's own assumption.
That is both weaker and stronger than it sounds. Weaker, because a simulation built on a lognormal assumption and checked against lognormal percentiles cannot detect a wrong assumption. Stronger, because it is the only comparison in the series where a numerical method is tested against a closed-form answer, and it is exactly the test a Monte Carlo needs: without an analytic benchmark, a simulation is a number generator with a seed.
The three numbers a reader should carry away
25.71% volatility, computed as the daily standard deviation times the square root of the trading year, and checked against that identity.
−0.229 beta, with a 0.0197 R-squared. Significant at 5%, explaining 2%. The workbook reports both, and the pair is the most useful thing in it.
A 0.0053 widest percentile gap. That is the sampling error of 10,000 paths in log-return terms, and it puts a number on how precisely the distribution is known.
What none of it covers
Four things, and they are structural rather than omissions.
One asset, one year. No portfolio, no covariance, no second regime. Every statistic describes 249 days.
The distribution is assumed. No normality test, no autocorrelation test, no volatility clustering. The checks confirm the simulation matches the assumption, not that the assumption is right.
No out-of-sample split. Every number is in-sample, and the limits sheet does not claim otherwise.
No efficient frontier. The workbook's own title is a return and risk simulator; the optimizer with constraints lives in the portfolio topic.
How to read the sheet
Start with the data checks, because everything else inherits from them. Then the identities, which are the cheapest way to catch a wrong formula. Then the simulation comparison, which is the only place a numerical method meets its closed form. Then the regression reporting, which is where the model hands a judgement to the reader.
That order is the same order the workbook's check sheet uses, and it is the reason 31 is enough: each group answers a question the next one depends on.
The returns article starts at the data, the Monte Carlo piece is the closed-form comparison, the beta article is the judgement, and the quantitative hub holds the complete check sheet. The smallest object in the sheet is the probability tree, and the layer this workbook leaves out is the efficient frontier.
Because Mica built the model inside the workbook, the simulation, the regression and the checks all read the same return series.