
Two ways to estimate a P&L
Under five curve shocks, a full reprice and a duration-plus-convexity prediction must agree. The gap between them is what a delta-gamma hedge leaves exposed. The workbook's tightest control sits at 43.6% of its tolerance.
Take a portfolio, move the curve, and ask what happens. There are two answers.
Reprice. Discount every cash flow at the shocked curve and subtract. This is the truth, given the model.
Predict. Use duration and convexity:
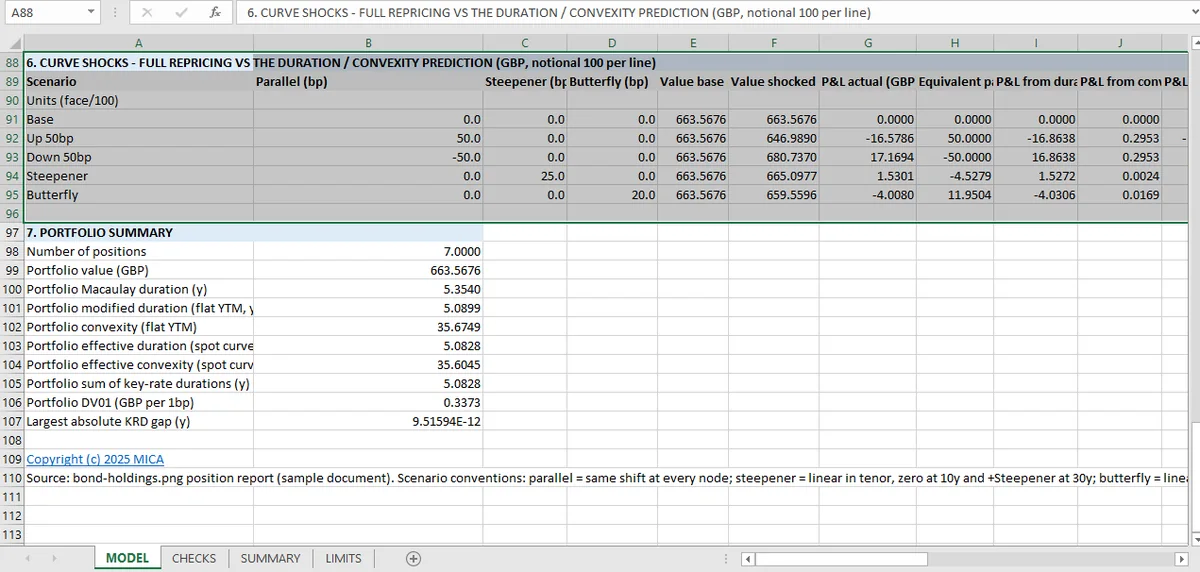
Five shock scenarios in the workbook, each computed both ways. The checks compare them.
Why Prediction and Reprice Agree on a Parallel Shift
For a parallel shift of a plain-vanilla portfolio, the two are the same calculation truncated at second order. The prediction error is third order in the shock, so on a one basis point move the two agree to the fourth decimal, and on a hundred basis points they visibly diverge.
The divergence is not a defect; it measures what a duration-plus-convexity hedge leaves exposed.
What the checks assert
Five pairs, one per shock. Each compares the full reprice with the prediction and requires the difference to be inside tolerance.
The tolerance choice is the interesting part. Too tight, and the check fails on a legitimate truncation error; too loose, and it passes a broken duration. The workbook's tightest control sits at 43.6% of its tolerance: close enough to catch a real error, loose enough to allow the second-order approximation.
That ratio is the number to look at on any check sheet. A control at 99% of tolerance is one rounding change away from a false failure, and one that sits at 1% is probably comparing something to itself.
What the residuals tell you
Three regimes, and the workbook's five shocks span them.
Small shocks. The prediction is effectively exact. The residual is numerical noise, and the check is really testing the arithmetic of the duration and convexity inputs.
Medium shocks. The residual becomes visible. Third-order and curve-shape effects start to matter, and the gap is a real measure of model risk for a delta-gamma hedge.
Large shocks. The second-order prediction is no longer good, and the residual is dominated by the shape of the curve rather than by the portfolio's convexity. At that point the useful comparison is not prediction against reprice but one repricing method against another.
What the five scenarios are not
They are parallel shocks. The curve moves as a whole, and the key-rate exposure decomposed in the additivity article is not exercised.
They are instantaneous. No carry, no passage of time, no reinvestment.
They are one-factor. A steepener, a flattener, a twist or a butterfly would each produce a different P&L, and none of them is in the workbook.
The workbook says so: the shock tests are five scenarios, and the limits entry notes there is no scenario table, no bump-and-reprice grid and no stress testing beyond these five. A fuller set is the argument in portfolio stress scenarios, which treats correlation and volatility shocks as part of the same scenario.
Why repricing wins
If the reprice is the truth, why compute the prediction at all?
Because the prediction is what a risk system reports, and a risk system's output is only useful if it reconciles to a full reprice under the conditions where it should. The tie-out is what makes the risk number trustworthy: duration is a number a trader will act on, and a duration that does not reproduce a reprice is a duration that will mis-hedge.
That is the same argument as the convexity check one level down, and it is the reason the workbook computes every analytic quantity twice: once by formula, once by bumping.
The fixed income hub holds all 55 checks, and the duration article is where the first-order input to the prediction comes from. The two inputs to that prediction are in the yield solve and the credit spread.
The repricing discipline is the same one described in the Excel-for-finance guide, and the financial-report automation guide is where the tie-out would be reported.
Every cash flow is repriced under the shocked curve in Mica, so the prediction is checked against the model rather than against itself.