

Four questions, twenty-four checks
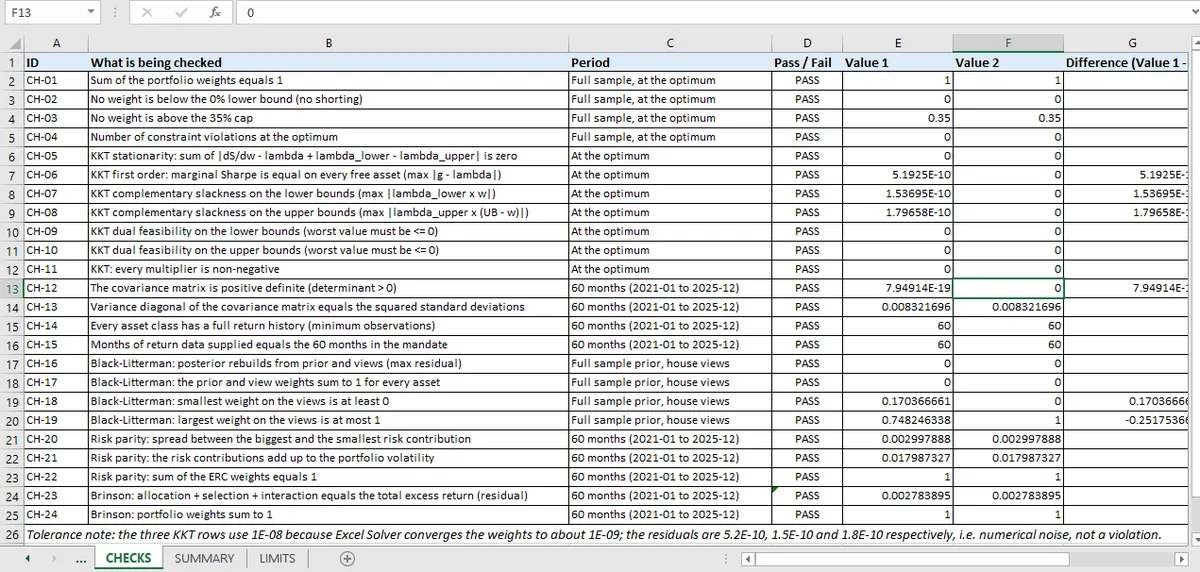
Twenty-four checks across four claims: is the portfolio investable, is it the optimum, are the inputs sound, and do the supporting models hold. Each group fails differently, which is why they are checked separately.
Most models answer one question. The portfolio workbook answers four, and the checks are grouped by which one.
| Question | Checks | What proves it |
|---|---|---|
| Is the portfolio investable? | 4 | Weights sum to one, bounds respected, zero violations |
| Is it the optimum? | 7 | KKT conditions, positive-definite covariance |
| Are the inputs sound? | 4 | Full history, covariance diagonal, positive definiteness |
| Does the story hold? | 9 | Black-Litterman rebuild, risk-parity identities, attribution additivity |
That is a different structure from the fixed-income workbook, where every check was a price against a reprice. Here the checks are against *conditions*: properties the answer must satisfy. Conditions are harder to fake.
The three results worth quoting
Weights of 29.6 / 0.4 / 0 / 35 / 0 / 35. Two assets at the cap and two at zero. That pattern is the optimizer telling you which constraints bind, and it is more informative than the return forecast that produced it.
A Sharpe ratio of 0.813 on a 9.97% return and 7.43% volatility.
Risk parity at 6.23% volatility, against 7.43% for the optimized portfolio. Same six assets, different objective, different portfolio. The workbook reports both rather than choosing.
What makes an optimization checkable
Three things, and the workbook has all three.
The objective is stated. Mean-variance with a 35% cap and no shorting. Without that, no check can say whether the answer is right.
The conditions are known. KKT conditions are necessary for a constrained optimum, and this problem is convex because the covariance matrix is positive definite, which is itself one of the checks.
The inputs are reproducible. Sixty months, six asset classes, the sample covariance. A reader can recompute.
The mandate and the 60 monthly returns were read from PDFs, and some fields needed more than one OCR pass. A misread 35% cap changes the feasible set; a bad monthly return changes the covariance matrix. The 24 checks test the solution to the problem as transcribed; the mandate and return file are the problem statement, not one of its answers.
The absence of any one of those would leave the 24 checks proving something narrower. A model without a stated objective can only be checked for internal consistency; one without a positive-definite covariance matrix can only be checked for feasibility.
What the Portfolio Model Does Not Do
No stress test. The limits sheet lists single-period and sample covariance; neither is challenged by scenario analysis. The stress article covers what that would add.
No transaction costs or turnover. The optimum is a destination, not a path.
No rebalancing rule. Nothing says how often the portfolio is recomputed or what happens when the weights drift.
No out-of-sample test. The covariance matrix and the expected returns come from the same 60 months the portfolio is built on.
Where to start reading
Start with the constraint scan: four numbers, and if any of them is off nothing else matters. Then the KKT residuals, which tell you whether the solver finished. Then the input checks, which tell you whether the problem was well posed.
The Black-Litterman and attribution groups are different: they are checks on *other* models inside the same workbook, and they can pass while the optimization is wrong, because they test a different calculation.
That is the thing to keep in mind about a multi-purpose workbook. Twenty-four passes do not mean one model is right; they mean four models each satisfy their own conditions, and the interesting failure is the one where a check passes because it is testing the wrong thing.
Two cores hold this together: optimality in the KKT article and feasibility in the constraint scan. The forecasting layer is Black-Litterman, the alternative allocation is risk parity, and the complete check sheet is in the portfolio hub.
The optimization, the risk-parity block and the attribution share one Mica workbook, so the same covariance matrix feeds all three. That shared input is the Excel structure the series recommends for a multi-model sheet.