

What attribution has to do
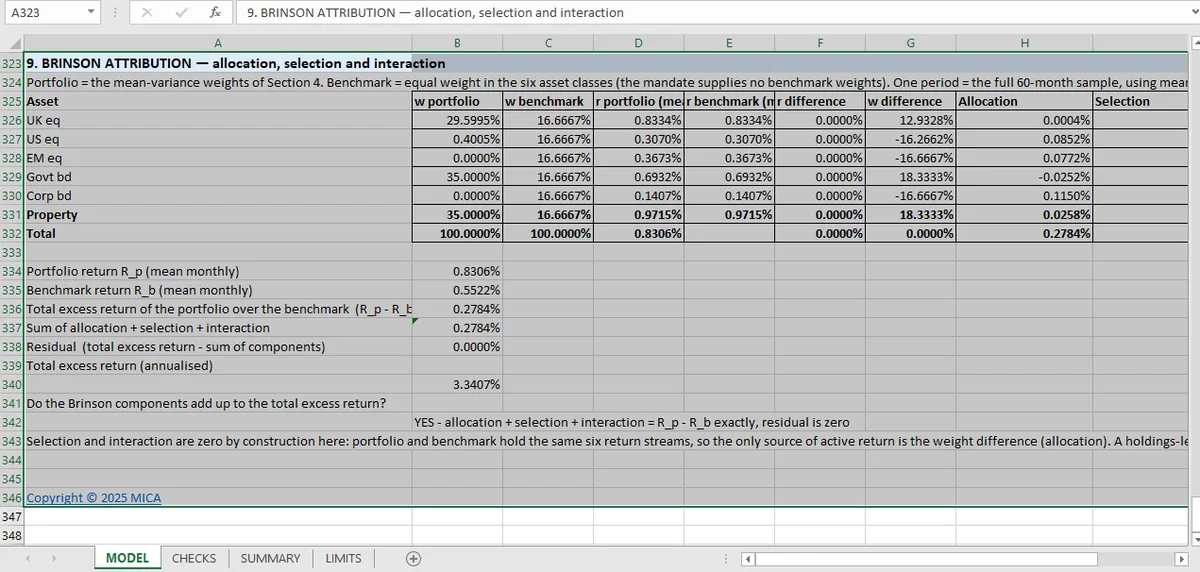
Brinson attribution splits a 0.278% monthly excess into allocation, selection and interaction. The three have to sum back exactly. The residual here is zero, which is what makes the decomposition a decomposition.
A portfolio outperformed its benchmark by 0.278% in a month. Attribution answers why: how much came from holding different weights, how much from picking different assets within those weights, and how much from the interaction.
Brinson decomposes the excess return into those three terms. The decomposition is useful only if it adds up exactly. Otherwise the unexplained residual is where the story hides.
The three terms
Allocation measures the effect of overweighting or underweighting asset classes relative to the benchmark, assuming the same returns within each class.
Selection measures the effect of holding different securities within a class, at benchmark weights.
Interaction is the cross term: the extra from being overweight a class that also outperformed.
For a single-fund portfolio, selection is often zero by construction: the "security" is the asset class itself. The workbook computes all three anyway, because the identity has to hold whether or not a term is zero.
The Three Additivity Checks in Attribution
Three, and they are all about the sum.
Allocation plus selection plus interaction equals the total excess. The residual is zero at the workbook's tolerance. That is the check that makes the attribution a decomposition rather than three estimates.
Portfolio weights sum to one. The same normalisation check as everywhere else, and the same failure mode.
The residual itself is reported. A number, not an assertion: 0.0. Reporting the residual rather than asserting it is better practice, because it lets a reader see the size of the unexplained part even when it passes.
Why the residual is the whole point
An attribution with a 0.05% residual on a 0.28% excess is not an attribution. It is a set of plausible explanations with a fifth of the answer missing, and the missing part is usually the term the model got wrong. That is the same standard as the shock P&L tie-out, where a prediction is only useful if it reconciles to a full reprice.
The common causes: a benchmark weight vector that does not sum to one, a currency effect that is not in any of the three terms, or a rebalancing timing difference that the monthly decomposition cannot see.
The workbook's residual being exactly zero tells you none of those is present, for this portfolio, this benchmark, this month.
What Brinson Attribution Does Not Tell You
Whether the attribution is economically meaningful. A 0.278% monthly excess decomposed into three small terms is arithmetically clean and statistically indistinguishable from noise. One month is one observation.
Whether the benchmark is right. It is an input. An attribution against the wrong benchmark answers a question nobody asked.
Whether the decomposition is the only one. Brinson has several variants: arithmetic versus geometric, with or without interaction folded into the other terms. The workbook uses one, and the choice changes the split while leaving the total unchanged.
The Link to Portfolio Optimization
Attribution is the mirror of optimization: the optimizer asks which weights to hold, the attribution asks what the chosen weights did. Both depend on the same covariance and return inputs, and both fail in the same way when those inputs are wrong.
The 24 checks establish that the attribution adds up. They do not establish that the month was long enough to attribute, which is a question about sample size rather than arithmetic. The out-of-sample article is the closest treatment of that problem in this series.
Attribution is the mirror of optimization, so the optimality conditions live in the KKT article. The constraint set the weights had to meet is in the constraint scan, and the forecasts behind them in Black-Litterman. The complete 24-check sheet is in the portfolio hub.
The three terms and the total sit in adjacent cells in Mica, so a non-zero residual is visible as a number. An adjacent total is the Excel check layout this series uses.