

The problem Black-Litterman solves
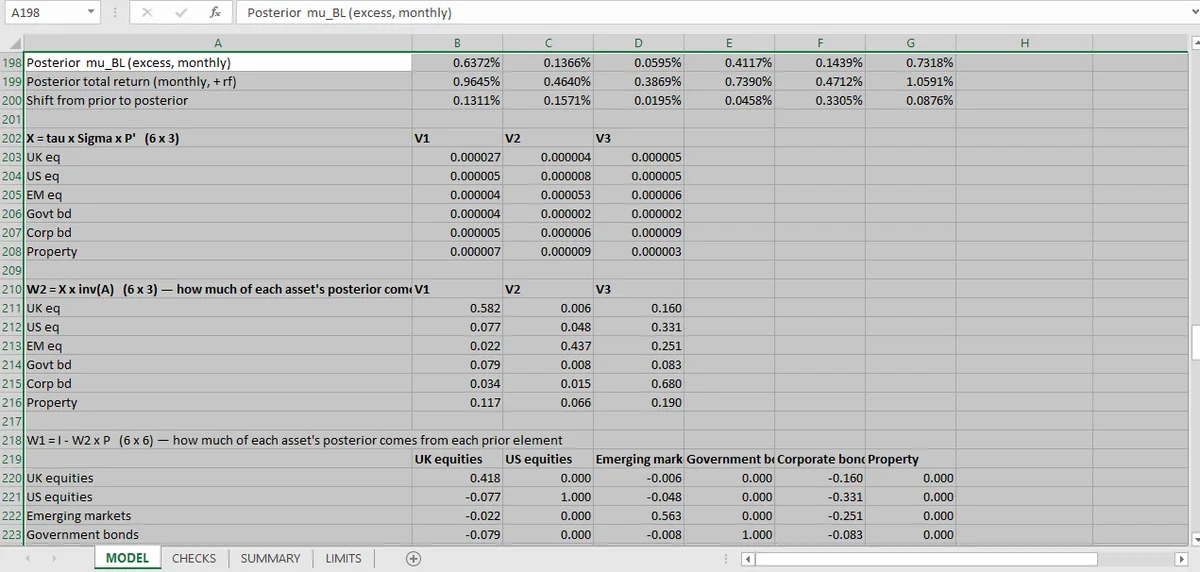
Black-Litterman replaces a raw return estimate with a posterior: a market-implied prior, updated by explicit views. The workbook rebuilds the posterior from its components and checks the blend behaves like a weighted average, with view weights between 0.17 and 0.75.
Mean-variance optimization needs expected returns. Those returns are the least reliable input in the whole model, and the optimizer amplifies their errors into extreme weights.
Black-Litterman replaces the raw estimate with a posterior: a prior implied by market weights, updated by explicit views. The output is a return vector that starts from what the market believes and moves only as far as the views justify.
That is a modeling choice, and the checks in the workbook test that the arithmetic of the blend is right.
The three inputs
The prior is derived from the covariance matrix and the market-capitalization weights, scaled by a risk-aversion parameter. It is the return vector that would make the market portfolio optimal. That reverse optimization is the mirror of the efficient frontier, which takes returns as given and solves for weights.
The views are statements with uncertainty: an asset will outperform another by some amount, with a stated confidence.
The blend is a matrix operation that weights prior and views by their relative uncertainty. The workbook computes it and reports the posterior.
The four checks
| Check | What it establishes |
|---|---|
| Posterior rebuilds from prior and views | The matrix operation is implemented as specified |
| Prior and view weights sum to 1 | The blend is a weighted average, not a rescale |
| Smallest view weight ≥ 0 | No asset's posterior is extrapolated from a negative contribution |
| Largest view weight ≤ 1 | No asset is driven entirely by views, bypassing the prior |
The rebuild check is the strong one: recompute the posterior from its components and compare with the reported vector. The maximum residual is zero at the workbook's tolerance.
The weight checks are structural. They assert that the blend behaves like a weighted average, which is what Black-Litterman is, rather than like an arbitrary transformation that happens to produce plausible numbers.
What the posterior looks like
For UK equities the posterior monthly excess return is 0.637%. The view weights range from 0.170 to 0.748, which means no asset's posterior is more than three-quarters driven by views and none is less than one-sixth.
That range is the most informative output in the section. A posterior that is 95% views is a view vector wearing a prior's clothing; one that is 5% views ignores the analyst entirely. The workbook reports the range rather than the point estimates, which lets a reader see how much of the answer is judgement.
What the checks cannot tell you
Whether the prior is right. It is implied by market weights and the covariance matrix. If the market portfolio is not optimal, and it is not, the prior is a convention.
Whether the views are right. They are inputs with confidence levels. A confident wrong view moves the posterior further than an uncertain right one.
Whether the posterior improves the portfolio. The workbook stops at the return vector. It does not re-optimize with it, so it does not measure whether the resulting weights are better than the raw-estimate ones.
That last gap is the one worth closing. Black-Litterman's justification is that its weights are more stable and more diversifiable than raw mean-variance; the workbook's 24 checks establish the arithmetic of the blend and leave the performance question untouched.
A posterior is only useful if the optimizer can act on it: the KKT article is what would run on the re-optimized weights, and the constraint scan is the feasibility side. The equal-risk alternative is risk parity, and the portfolio hub collects all 24.
The prior, the views and the blended weights are separate blocks in the Mica workbook, so the posterior can be reconstructed cell by cell. Separate blocks are the workbook layout that makes a rebuild check possible.